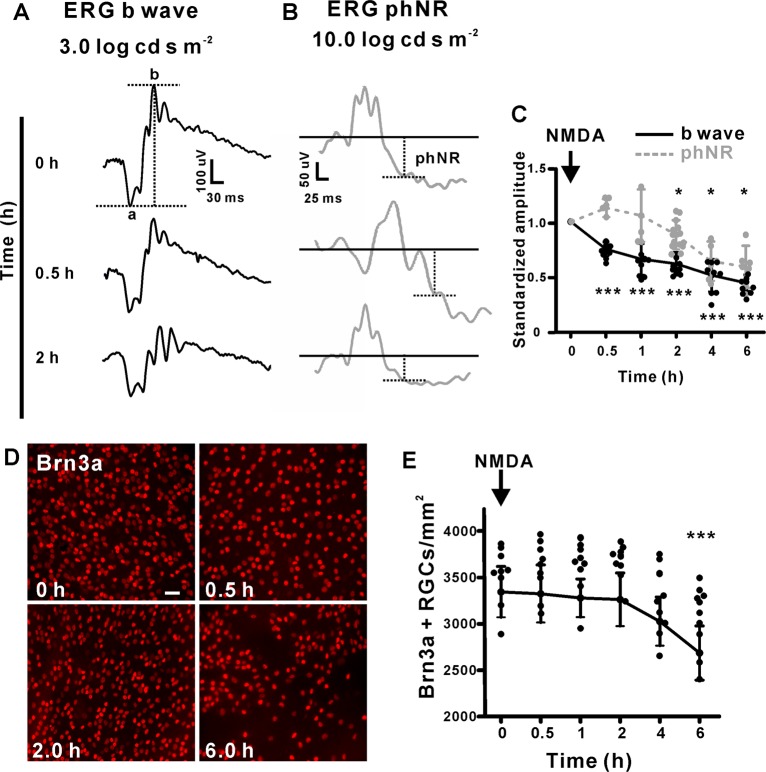
Fig. 3. Functional deficits in RBCs appears prior to RGC loss induced by NMDA.
a Representative scotopic ERG waves at different times after NMDA treatment. b Representative photopic ERG waves after 2 h of NMDA treatment. c Quantification of the b wave and PhNR amplitude at different time points of treatment. The standardized b-wave and PhNR of after injection of NMDA at the indicated times. 0.5, 1.0, 2.0, 4.0, and 6.0 h group, n = 9: 0.75 ± 0.06, P < 0.0001; 0.66 ± 0.14, P < 0.0001; 0.61 ± 0.11, P < 0.0001; 0.51 ± 0.15, P < 0.0001; 0.43 ± 0.08, P < 0.0001. d Example images of retinal flatmount preparations labeled with Brn3a (red). The number of labeled RGCs decreased significantly when treated with 0.05 mM NMDA for 6 h. (scale bar = 50 μm). e Quantification of the numbers of RGCs/mm2. The RGCs number of NMDA 0.5 h, 1.0, 2.0, 4.0, and 6.0 h group, n = 9: 3326.48 ± 311.43, P = 0.65; 3280.18 ± 205.39, P = 0.51; 3264.32 ± 287.20, P = 0.72; 3028.12 ± 262.96, P = 0.07; 2686.90 ± 292.91, P = 0.0002.

