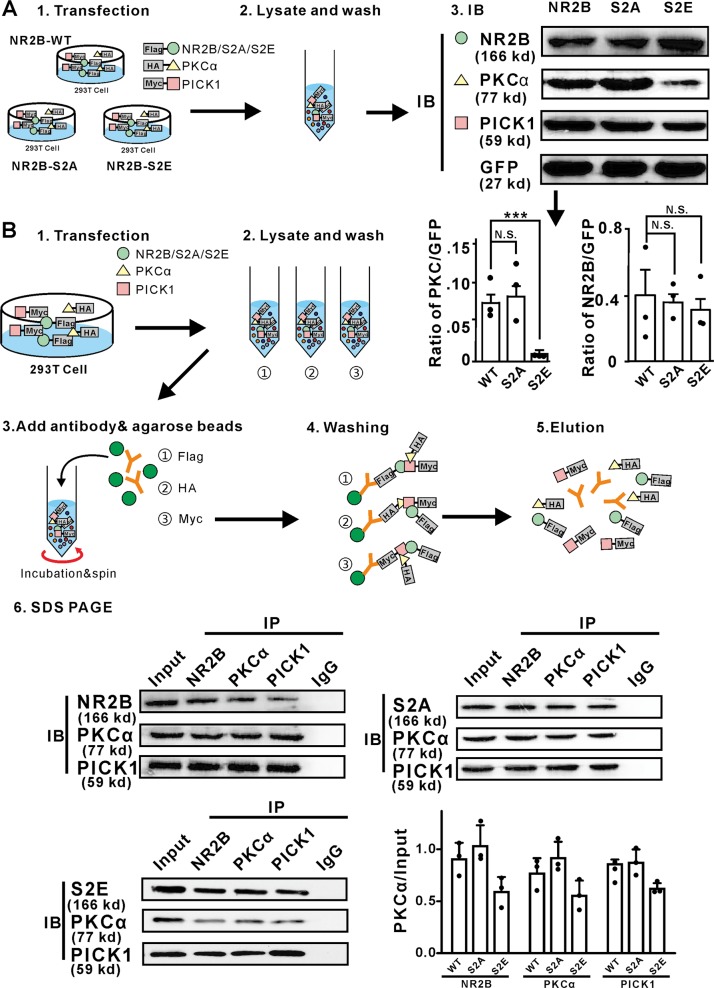
Fig. 5. NR2B interacted with PKCα through PICK1, phosphorylated NR2B leaded to promote PKCα degradation.
a HEK293T cell lysates co-transfected of NR2B (or NR2B-S2A, NR2B-S2E), PKCα, PICK1, and GFP plasmids were immunoblotted. The expression of PKCα decreased significantly when co-transfected with PICK1 and NR2B-S2E (**). The expression intensity of NR2B compared to GFP was not significantly different among three groups. The expression intensity of PKCα compared to GFP decreased significantly in NR2B-S2E group. Average intensity of PKCα/GFP: NR2B, 0.08 ± 0.01; NR2B-S2A, 0.09 ± 0.02, P = 0.1046, NR2B-S2E, 0.008 ± 0.0003, P = 0.0007. NR2B-S2A: The non-phosphorylated form of NR2B; NR2B-S2E: phosphorylated-mimicking form of NR2B. b HEK293T cell lysates co-transfected of NR2B (or NR2B-S2A, NR2B-S2E), PKCα and PICK1 plasmids were immunoprecipitated (IP) and immunoblotted (IB). The control was incubated with IgG antibody. NR2B, PKCα and PICK1 combined together as a triad complex. Average intensity of PKCα/Input of WT, S2A, and S2E group, n = 3: NR2B: 0.90 ± 0.16; 1.03 ± 0.20, P = 0.5958; 0.5958pnt, P = 0.2100; S2A: 0.77 ± 0.15, P = 0.1606; 0.9106776, P = 0.1606, P = 0.4933; 0.55 ± 0.15, P = 0.4933; S2E: 0.86:4933; 0.87 ± 0.13, P = 0.5732; 0.62 ± 0.06, P = 0.09.

