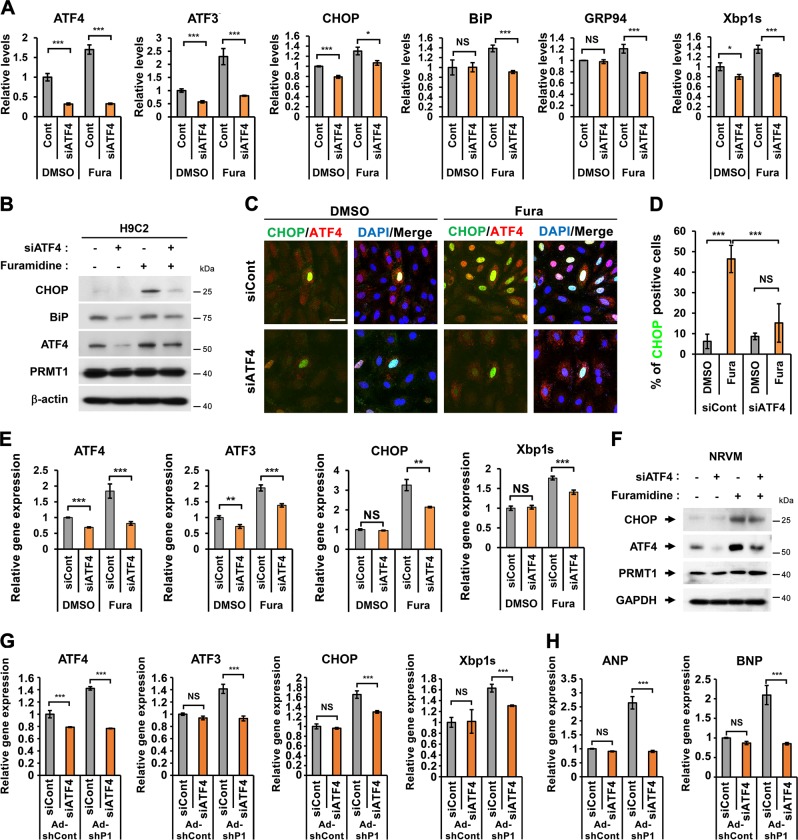
Fig. 4. The ER stress response triggered by PRMT1 inhibition is attenuated by ATF4 knockdown in rat cardiomyocytes.
a The expression of ATF4, ATF3, CHOP, BiP, GRP94, and Xbp1s in control or siATF4-transfected H9C2 cells followed by the treatment with control DMSO or Fura for 24 h. n = 3. Error bar shows ±SD. NS not significant, *P < 0.05, ***P < 0.005. b Immunoblot analysis for ATF4, BiP, CHOP, and PRMT1. β-actin were used as loading control. c Representative confocal images for CHOP and ATF4 in control or siATF4-transfected H9C2 cells treated with control DMSO or Fura for 24 h. n = 3 fields per each experiment with three independent experiments. Scale bar = 20 μm. d Quantification of CHOP-positive H9C2 cells in panel (c). Values are determinants of 12 fields ±SD. NS not significant, ***P < 0.005. Experiments are repeated three times with similar results. e The relative gene expression of ATF4, ATF3, CHOP, and Xbp1s in control or siATF4-transfected NRVMs with DMSO or Fura treatment for 24 h. n = 3. Error bar shows ±SD. NS not significant, **P < 0.01, ***P < 0.005. f Immunoblotting analysis for CHOP, ATF4, and PRMT1 in control or siATF4-transfected NRVMs with DMSO or Fura treatment for 24 h. g, h The mRNA expression of ATF4, ATF3, CHOP, Xbp1s, and hypertrophic gene ANP and BNP in NRVM cells transduced with Ad-shCont or Ad-shPRMT1 along with transfection with control scrambled or siATF4. n = 3. Error bar shows ±SD. NS not significant, ***P < 0.005.

