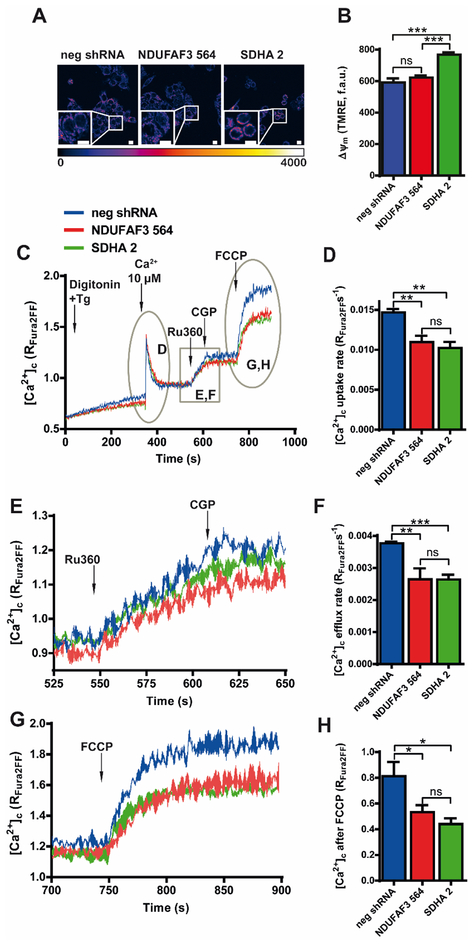
Figure 2. Effects of NDUFAF3 and SDHA knockdown on mitochondrial membrane potential and Ca2+ influx and efflux rates.
A. Representative confocal images of neg shRNA, NDUFAF3–564 and SDHA-2 MCF7 cell lines loaded with mitochondrial membrane potential indicator TMRE. B. Quantification of TMRE fluorescence C. Representative Ca2+ traces of neg shRNA, NDUFAF3–564 and SDHA-2 MCF7 cell lines permeabilized with 40 μg/mL of digitonin and loaded with the ratiometric Ca2+ indicator Fura 2-FF. A pulse of 10 μM Ca2+ was added at 350 s to measure mitochondrial Ca2+ uptake, followed by the addition of 1 μM Ru360 at 550 s, 10 μM CGP37157 at 610 s, and 2 μM uncoupler FCCP, at 750 s. D. Quantification of Ca2+ uptake rate. E. Magnification of Ca2+ efflux from panel A (between 525 and 650 s). F. Quantification of Ca2+ efflux rate after addition of RU360. G. Magnification of Ca2+ release after FCCP addition from panel A (between 700 and 900 s). H. Quantification of FCCP-induced release of mitochondrial Ca2+. All data shown represent mean ± SEM of three independent experiments. *p<0.05, **p<0.01, ***p<0.001. ns = not significant.

