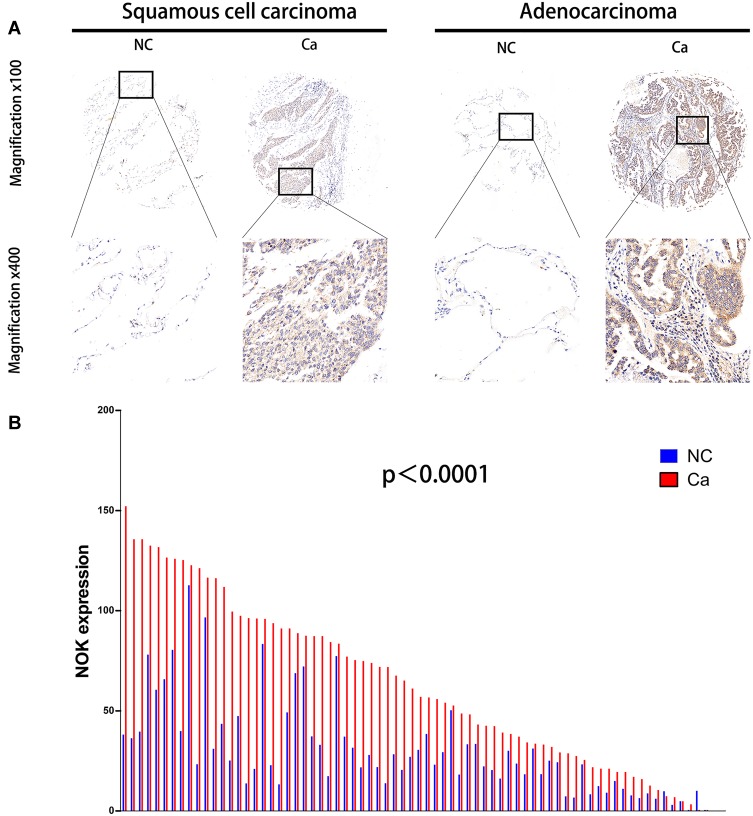
Figure 1.
Expression of NOK in human NSCLC cancerous tissues (Ca) compared with normal lung tissues (NC). (A) Two paired representative examples (one squamous cell carcinoma case, left hand; one adenocarcinoma case, right hand) of NOK IHC from one NSCLC patient showing higher NOK expression in the cancerous tissue. Magnification, x100 (upside); x400 (downside). (B) Protein levels of NOK in 72 pairs of cancerous tissues and adjacent normal tissues according to IHC scores. Paired t-test, P<0.0001.

