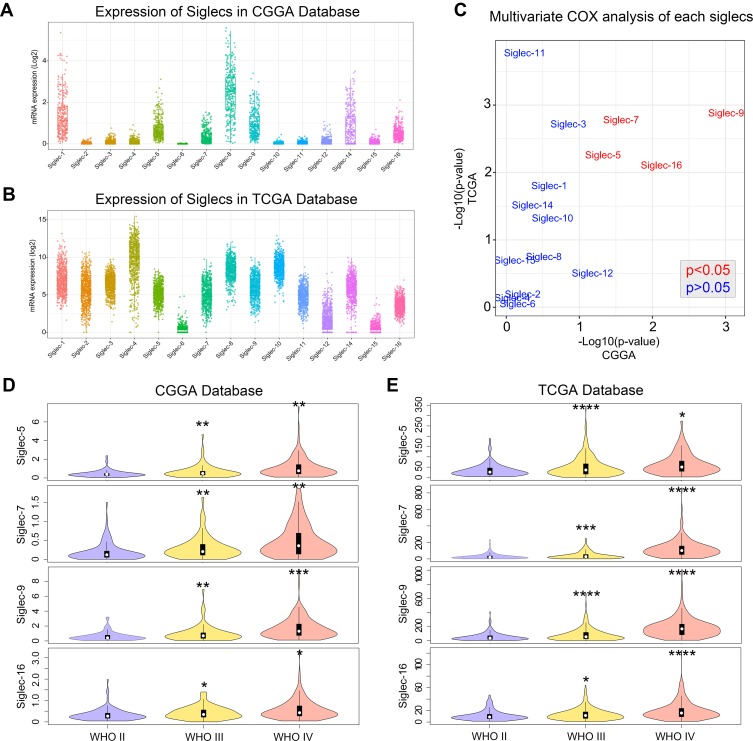
Figure 1.
Expression landscape of Siglec family members in glioma. (A, B) Transcriptome expression map of Siglecs in the CGGA and TCGA database. (C) p-values for multivariate Cox analysis of each Siglec member in the CGGA and TCGA databases. Variables in the multivariate Cox analysis included Siglec member, WHO grade, age, and IDH mutation status. Red font indicates an independent prognostic factor. (D, E) Violin plot showing the expression of Siglecs in each WHO grade glioma according to the CGGA and TCGA databases. *p<0.05, **p<0.01, ***p<0.001, ****p<0.0001.

