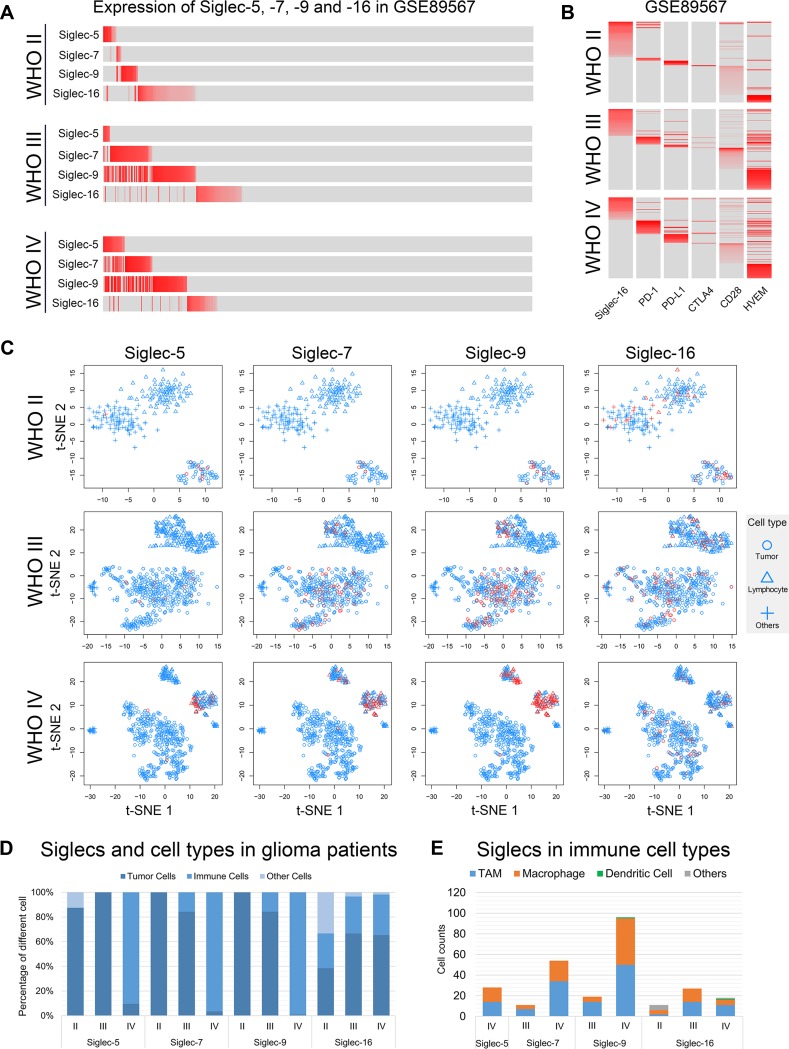
Figure 6.
Immunological characteristics are different in Siglec-5, −7, −9, and −16. (A) Expression of Siglec-5, −7, −9, and −16 in glioma cells of each WHO grade. The expression level is represented by the shade of red. Gray indicates no expression. (B) Expression of Siglec-16 and immune checkpoints in glioma cells of each WHO grade. The expression level is represented by the shade of red. Gray indicates no expression. (C) Spatial mapping analysis of each WHO grade glioma. Red indicates that Siglec was expressed in the cell. Cells without Siglec expression are colored blue. (D) The distribution proportion of Siglec members in each cell type. (E) Number of immune cells with Siglec members expressed.

