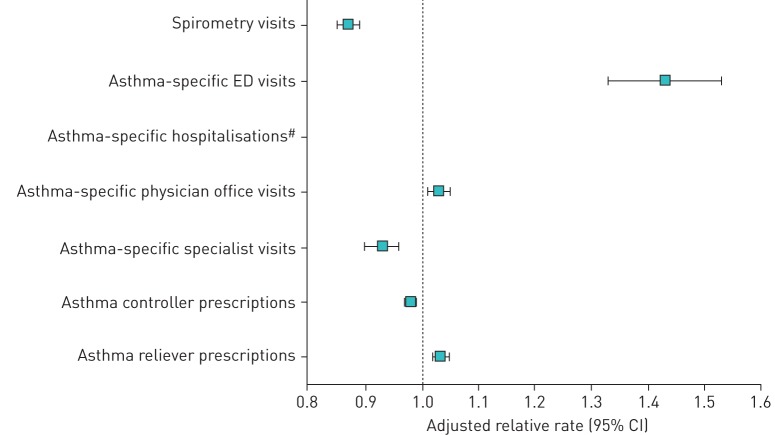
FIGURE 1.
Forest plot for adjusted relative rates of asthma-specific health services use and prescriptions for women versus men. The multivariate negative binomial regression models were adjusted for age at baseline, age at asthma prevalence, Collapsed Aggregated Diagnosis Groups, Ontario Marginalization Index, local health integration networks, rurality and COPD; offset by log(years observed). Data are shown for the study population (n=209 054). ED: emergency department. #: the negative binomial regression model did not converge.

