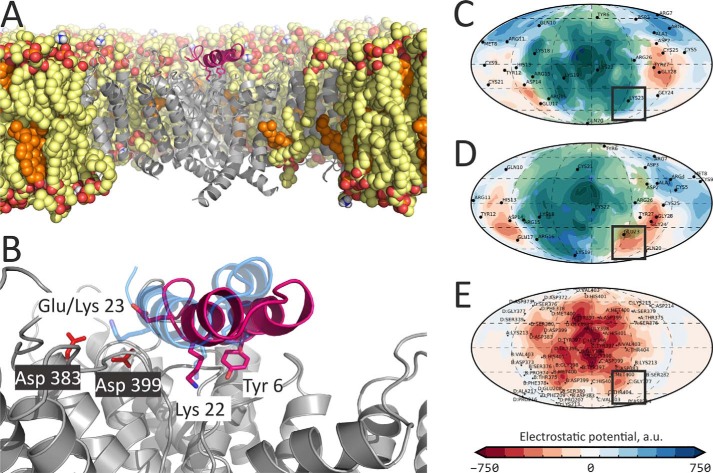
Figure 2.
Molecular model of the Kv1.3–Tk-hefu complex suggests rational design of the Tk-hefu-2 high-affinity peptide. A, overall structure of the Kv1.3–Tk-hefu complex after 200-ns MD simulation inside a hydrated lipid bilayer membrane. Kv1.3 is in gray; the pore domain helices of the second protomer and voltage-sensing domain (VSD) of the fourth protomer, as well as extended extracellular loops of the VSDs are omitted for clarity. Lipids are shown in a space-filling representation; atoms are colored: oxygen, red; phosphorus, orange; nitrogen, blue; carbon of phospholipids (POPC and POPE), yellow; carbon of cholesterol, orange. Some lipids are omitted for clarity. Tk-hefu is presented in pink; the functional dyad residues Tyr-6 and Lys-22, as well as Glu-23 are shown as sticks. B, close-up view on Tk-hefu from A overlaid with Tk-hefu-2 for comparison. Asp-383 and Asp-399 of the channel are shown. Tk-hefu-2 is presented in semi-transparent blue, and lipids are omitted for clarity. C–E, protein surface topography maps showing ELP distribution in Kv1.3–Tk-hefu/Tk-hefu-2 complexes: C, Tk-hefu-2; D, Tk-hefu; E, Kv1.3. Semi-transparent green areas in C and D show contact areas with the Kv1.3 channel in complexes. Black boxes highlight the area, where ELP complementarity may be improved by the E23K substitution in Tk-hefu yielding Tk-hefu-2.

