Figure 4.
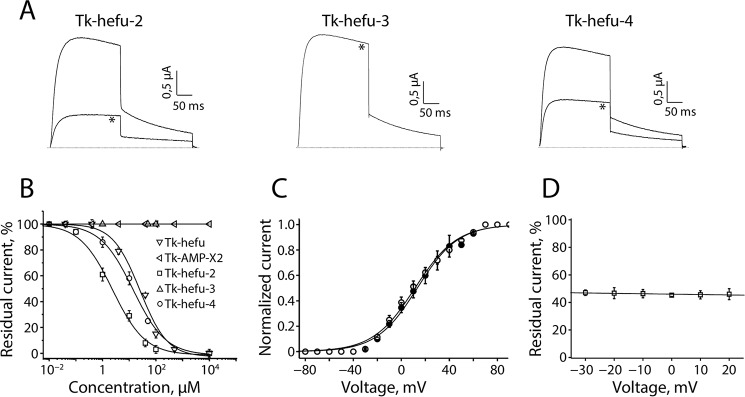
Tk-hefu-2, -3, and -4 block of human Kv1.3 channels studied by electrophysiology. A, activity of Tk-hefu mutants on Kv1.3 channels expressed in Xenopus laevis oocytes. Traces shown are representatives of at least six independent experiments (n ≥ 6). The dotted line indicates the zero current level. The asterisk (*) distinguishes the steady-state current after application of 10 μm peptide. B, concentration-response curves for Tk-AMP-X2, Tk-hefu, Tk-hefu-2, -3 and -4 on Kv1.3 channels obtained by plotting the percentage of remaining current as a function of increasing ligand concentrations. Error bars indicate the mean ± S.E. C, current-voltage relationship of Kv1.3 channels. Closed symbols, control condition; open symbols, after application of 2 μm Tk-hefu-2. D, percentage of inhibition upon application of 2 μm Tk-hefu-2 at a broad range of potentials is shown.

