Figure 5.
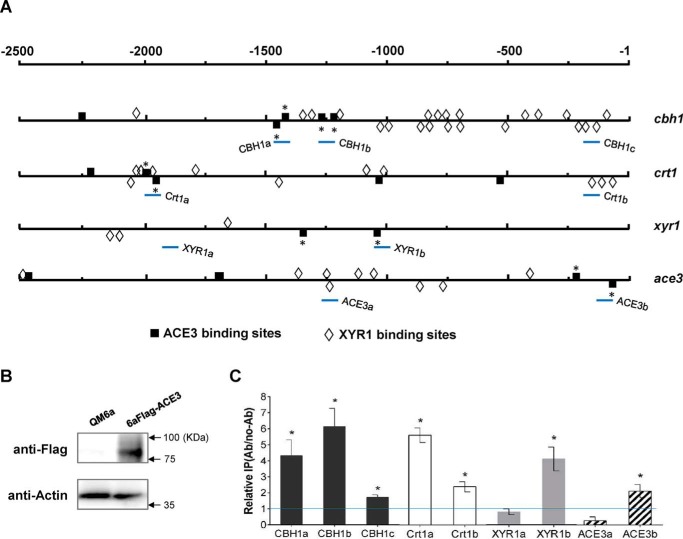
ACE3 binds to promoters in vitro and in vivo. A, schematic representation of the localization of 5′-GGC(A/T)3–3′ and 5′-CGGAN(T/A)3–3′ motifs within the 2.5-kb upstream region of cbh1, crt1, xyr1, and ace3 genes. The 5′-CGGAN(T/A)3–3′ motifs analyzed in the electrophoretic mobility shift assay (Fig. S9) are indicated with an asterisk. The promoter regions for ChIP analysis are shown as CBH1-a, CBH1-b, CBH1-c, Crt1-a, Crt1-b, XYR1-a, XYR1-b, ACE3-a, and ACE3-b (bottom lines). B, design of the ChIP studies. FLAG-tagged ACE3 is generated in the 6aFLAG-ACE3 strain. Expression is confirmed via Western blot analysis. Parental strain QM6a was used as a negative control. Thirty micrograms of total protein were loaded into each lane, and the expression of β-actin was used as a positive reference. C, a ChIP assay was performed with 6aFLAG-ACE3 cells grown in lactose. Immunoprecipitation was conducted using anti-FLAG antibody. Relative IP levels were normalized to Ab/no-Ab at the PSAR1 region, which used as a reference. Ratios higher than 1 were considered as the enrichment of the DNAs due to ACE3 binding. Error bars, S.D. of three biological replicates. Asterisks, significant difference compared with the untreated strain (*, p < 0.05, Student's t test). ACE3 binds to the promoters of CBH1, Crt1, XYR1, and ACE3 with higher binding activity near the 5′-GGC(A/T)3–3′ and 5′-CGGAN(T/A)3–3′ motifs. Error bars, S.D.

