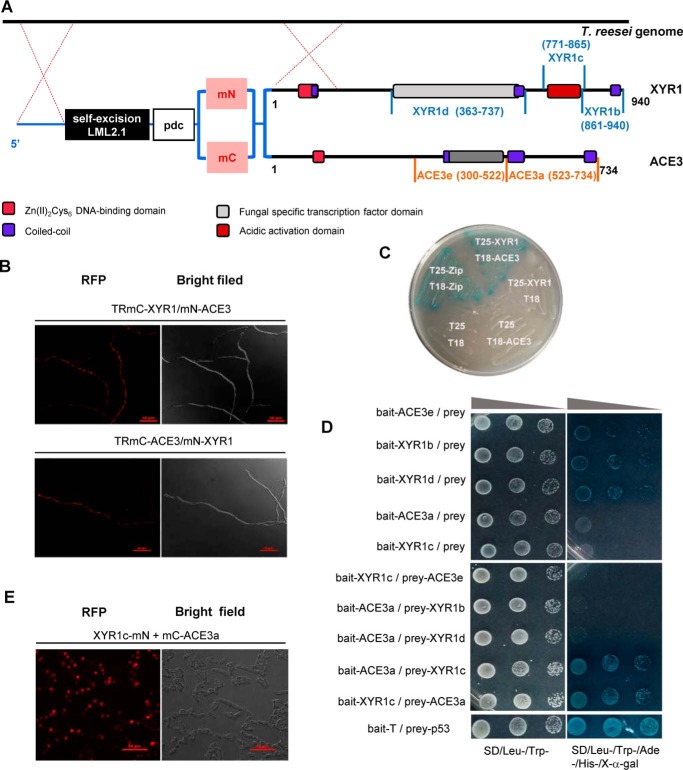
Figure 6.
ACE3 interacts with XYR1. A, construction of co-expression strains RmC-XYR1/mN-ACE3 and TRmC-ACE3/mN-XYR1. The two domains of mCherry (mN and mC) were fused with the N terminus of XYR1 or ACE3. The mCherry-fused XYR1 and ACE3 were under the control of the pdc promoter and were transformed into T. reesei. The structure of XYR1 is from Lichius et al. (24). B, BiFC assay results revealed the protein–protein interactions of XYR1 and ACE3. Positive interactions resulted in fluorescence. C, B2H assay results revealed the protein–protein interactions of XYR1 and ACE3. The strain expressing T25-XYR1 and T18-ACE3 fusion proteins was observed as a blue colony, which indicates a positive protein–protein interaction. D, Y2H assay results revealed the protein–protein interactions of XYR1c and ACE3a domains. The vectors pGBKT7 and pGADT7 were used for the expression of bait and prey proteins, respectively. XYR1b (amino acids 861–940 of XYR1), XYR1c (amino acids 771–865 of XYR1), and XYR1d (amino acids 363–737 of XYR1), ACE3a (amino acids 523–734 of ACE3), and ACE3e (amino acids 171–522 of ACE3) were all cloned into bait or prey plasmids. The yeast strains Y187 and Y2HGold were used as hosts for transforming bait- and prey-relating vectors, respectively. The positive isolates observed after yeast mating were selected on S.D. plates lacking tryptophan and leucine (Trp−, Leu−). Then the concentration of the positive isolates was adjusted until OD600 values of 2, 0.2, and 0.02 were obtained, and 5 μl of each solution with a specific concentration was spotted on plates lacking tryptophan and leucine (Trp−, Leu−) and on selection plates lacking tryptophan, leucine, and histidine (Trp−, Leu−, His−) containing 125 ng/ml aureobasidin A (AbA) and 40 μg/ml X-α-galactosidase (X-α-gal). Plates were grown at 30 °C for 3–5 days. Positive interactions resulted in blue spots. Bait-T/prey-p53 was used as the positive control. E, BiFC assay results revealed the protein–protein interactions of XYR1c and ACE3a domains. Strains expressing protein partners fused with mN or mC are indicated in each panel. Positive interactions resulted in fluorescence.

