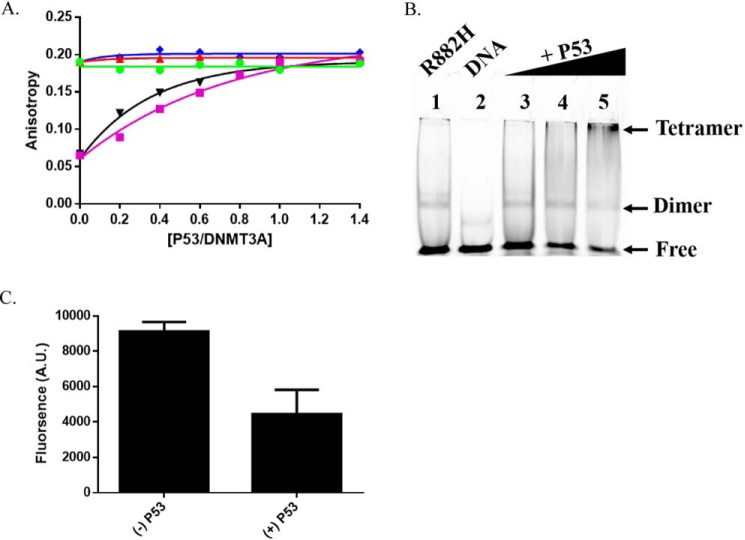
Figure 5.
p53 heterodimerizes with WT and R882H DNMT3A. A, increasing concentrations of DNMT3L (purple square) or p53WT (▾) to a fixed concentration of DNMT3AR882H led to a robust increase in anisotropy, whereas DNMT3AWT did not display a significant change in anisotropy by the titration of DNMT3L (green circle), p53WT (red triangle), or p53R248W (blue diamond). B, EMSA and C, EMSA band densitometry (lanes 1 and 5) show increasing concentrations of p53WT (lanes 3-5) to a constant concentration of DNMT3AR882H leads to disappearance of the DNMT3AR882H band and formation of a higher order structure (see arrows, lanes 3-5). In A, DNMT3AWT and DNMT3AR882H concentrations were 2.5 μm. Single point anisotropy measurements were taken after increasing concentrations of DNMT3L (green circle), p53WT (red triangle), and p53R248W (blue diamond) were added to DNA bound (250 nm 5′ 6-FAM-labeled GCbox30) DNMT3AWT and DNMT3AR882H and allowed to incubate at room temperature for 5 min. Measurements were taken using a fluorometer equipped with polarizing filters (excitation, 485 nm; emission, 520 nm). In B, gel shift assays were carried out as described in Holz-Schietinger et al. (28) and other than samples were run on native 4.5% polyacrylamide gels and binding reactions were performed at 37 °C (lane 1). For p53WT supershifting, varying concentrations of p53WT were preincubated for 30 min at 37 °C with DNMT3AR882H before the addition of DNA. A and C reflect the results (mean ± S.D.) of 2 independent experiments.

