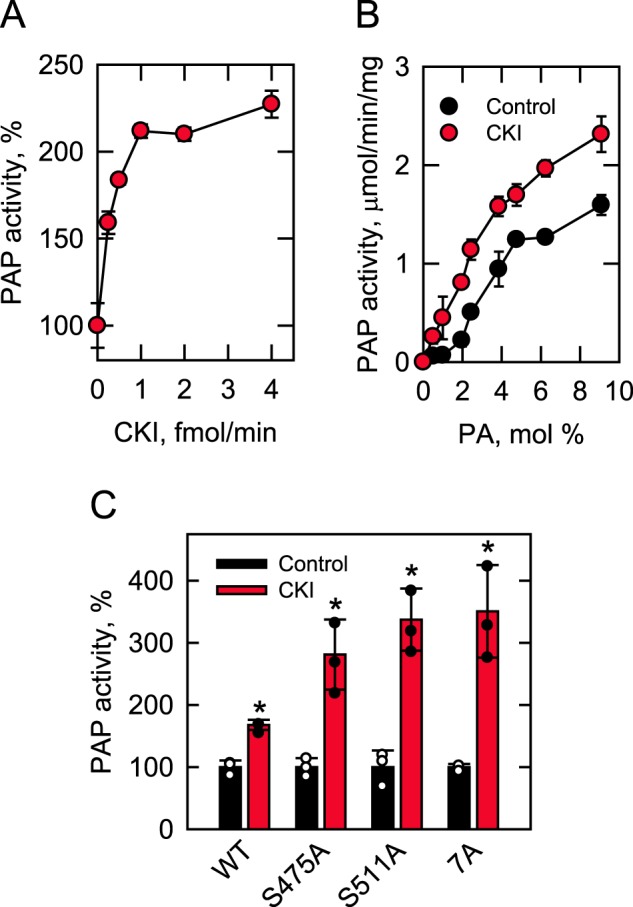
Figure 5.

Phosphorylation of Pah1 by CKI stimulates PAP activity. Pah1 (10 μg/ml) was phosphorylated by CKI for 30 min with 100 μm ATP. After the phosphorylation, the PAP activity was measured by following the release of Pi from PA. The indicated amounts of CKI were used for the phosphorylation of Pah1 in A, whereas 4 fmol/min of CKI was used for the phosphorylation in B and C. PAP activity was measured with the indicated surface concentrations (mol %) of PA in B, whereas 9 and 2.4 mol % PA, respectively, were used for the measurement of PAP activity in A and C. The surface concentrations of PA were obtained by maintaining the molar concentration of PA at 0.2 mm and varying the molar concentration of Triton X-100 (73). The data shown are means ± S.D. (error bars) from triplicate assays. The individual data points are also shown in C. *, p < 0.05 versus control. Control, unphosphorylated; CKI, phosphorylated; S475A and S511A, CKI phosphorylation site mutations; 7A, Pho85–Pho80 phosphorylation site mutations.
