Figure 1.
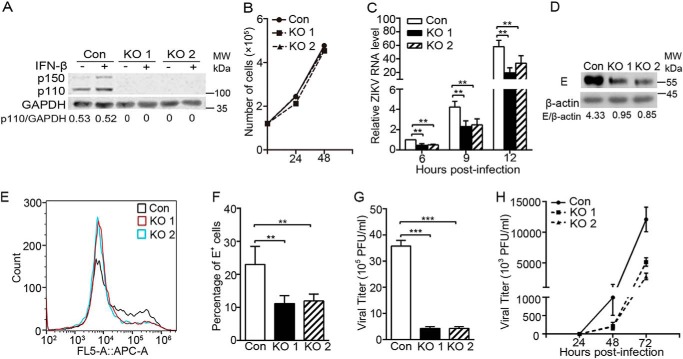
The ZIKV replication was impaired in ADAR1 knockout cells. A, Western blotting to detect the levels of ADAR1. The ADAR1 KO A549 cells were generated by the CRISPR/Cas9 technique. Two different knockout cells (ADAR1 KO1 and ADAR1 KO2) were confirmed by genomic DNA sequencing and subjected to Western blotting. GAPDH was probed as an internal control. The ratios of p110/actin were quantified by Quantity One, as shown below the representative blot of three independent experiments. B, cell growth curve of ADAR1 KO cells. Cell numbers were counted by trypan blue staining. C–G, virus replication levels in the ADAR1 KO cells. Control cells or ADAR1 KO cells were infected with ZIKV at MOI 3. Cells were harvested at the indicated time points for viral RNA measurement (C) or at 24 h p.i. for Western blotting (D) or flow cytometry (E and F); the supernatants were collected at 24 h p.i. for the plaque assay (G). H, multistep virus growth assay. Control cells and ADAR1 KO cells were infected with ZIKV at MOI 0.01. At 24, 48, and 72 h p.i., the supernatants were collected for the plaque assay. Data are shown as mean ± S.D. (error bars) of at least three independent experiments. **, p < 0.01; ***, p < 0.001, unpaired, two-tailed Student's t test.

