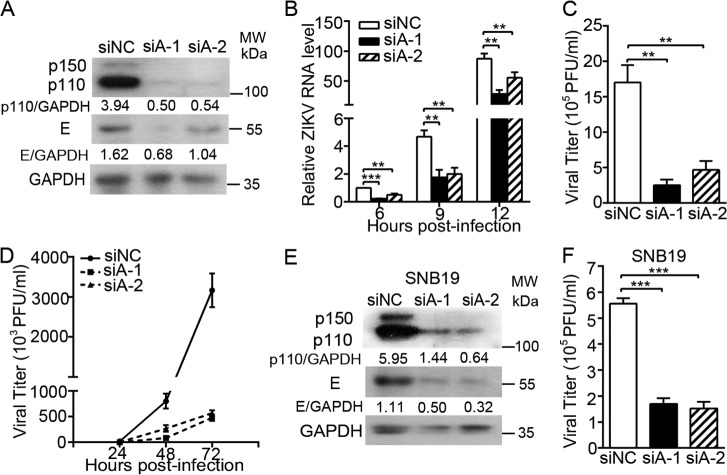
Figure 2.
Effect of ADAR1 knockdown on the ZIKV replication. A–C, virus replication levels. A549 cells were transfected with siRNAs for 48 h, followed by ZIKV infection at MOI 3. Cells were harvested at 24 h p.i. for real-time PCR to measure the viral RNA level (A) or for Western blotting to measure the viral protein E level (B); the supernatants were collected at 24 h p.i. for the plaque assay (C). D, multistep virus growth assay. siRNA-transfected cells were infected with ZIKV at MOI 0.01. At 24, 48, and 72 h p.i., the supernatants were collected for the plaque assay. E and F, viral replication levels in SNB19 cells. The SNB19 cells were transfected with siRNA, followed by ZIKV infection at MOI 3. Cells and supernatants were harvested at 24 h, and viral protein levels (E) and viral yields (F) were measured as above. Data are shown as mean ± S.D. (error bars) of at least three independent experiments. **, p < 0.01; ***, p < 0.001, unpaired, two-tailed Student's t test.

