Figure 3.
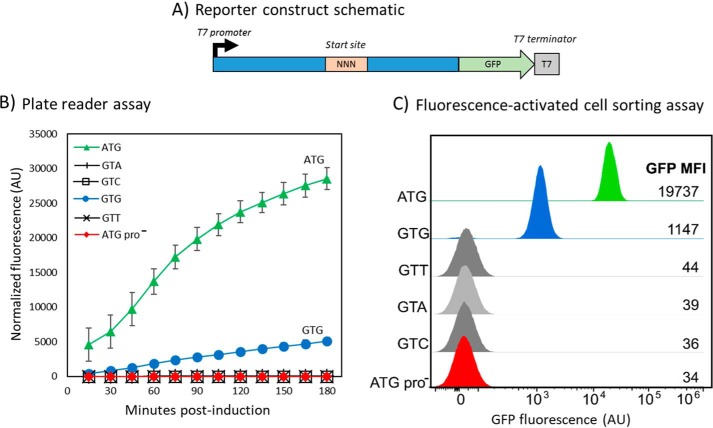
GFP analysis of the internal initiation region. A, a schematic representation of the GFP reporter construct of the eNISTmAb. “NNN” designates the location of the different codons tested. The regions in blue are the flanking regions of the putative internal initiation site, and that in green is the sequence encoding GFP. The T7 promoter and terminator regions are also shown. B, the results of the plate reader assay for the different codons used as initiation sites. A construct in which the promoter was removed (ATG pro−) is also shown. Fluorescence values are normalized to optical density of the cultures and corrected as described under “Experimental procedures”. The results and standard deviation (error bars) from four independent experiments are shown. Note that error bars are within the data markers in some instances, and trend lines are shown only for clarity. AU, arbitrary units. C, FACS analysis of the internal initiation site. GFP intensity histograms for each of the start-codon constructs of the eNISTmAb tested. A construct in which the promoter was removed (ATG pro−) is also shown. MFIs are reported for the GFP-positive populations. The intensity axis is shown in biexponential scaling. AU, arbitrary units.

