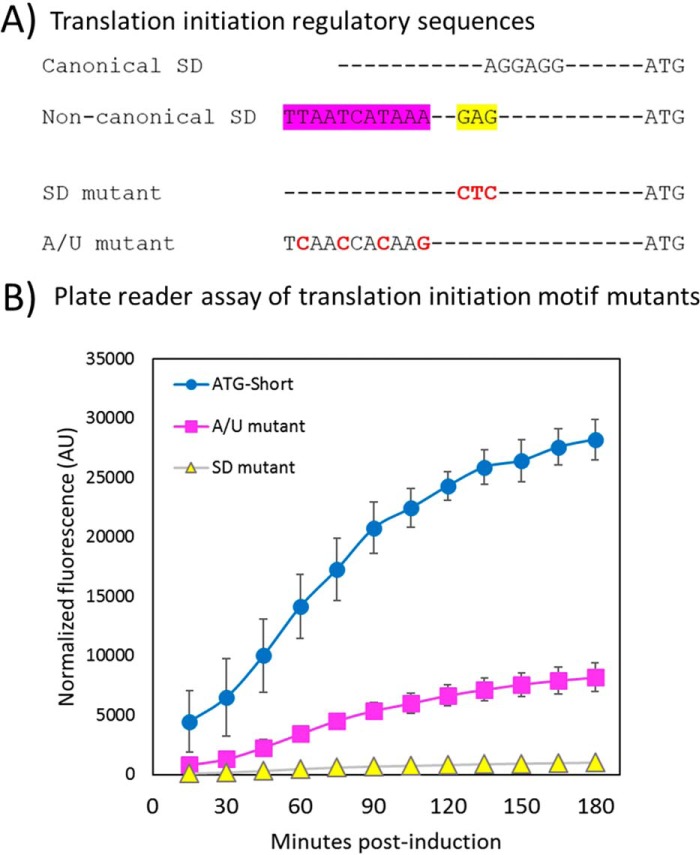
Figure 6.
Mutational analysis of the putative translation initiation region. A, the canonical SD sequence AGGAGG is optimally 6–8 bases upstream of the start codon and is shown as the reference SD sequence. The weak SD sequence from the eNISTmAb contains a sequence resembling the canonical SD (highlighted yellow) and an A/U-rich region (shown as A/T highlighted in pink). Translation initiation motif mutations to the weak SD and the A/U-rich region are shown in red. These are respectively labeled as “SD mutant” and “A/U mutant.” B, mutations were made to the weak SD sequence and an A/U-rich sequence using the ATG-Short construct as a template (Fig. 4B, construct IX). Each mutant was assayed as described by the plate reader GFP assay under “Experimental procedures”. The results and standard deviation (error bars) from three independent experiments are shown. Fluorescence values are normalized to optical density of the cultures and corrected as described under “Experimental procedures.” AU, arbitrary units. Note that error bars are within the data markers in some instances.

