Figure 1.
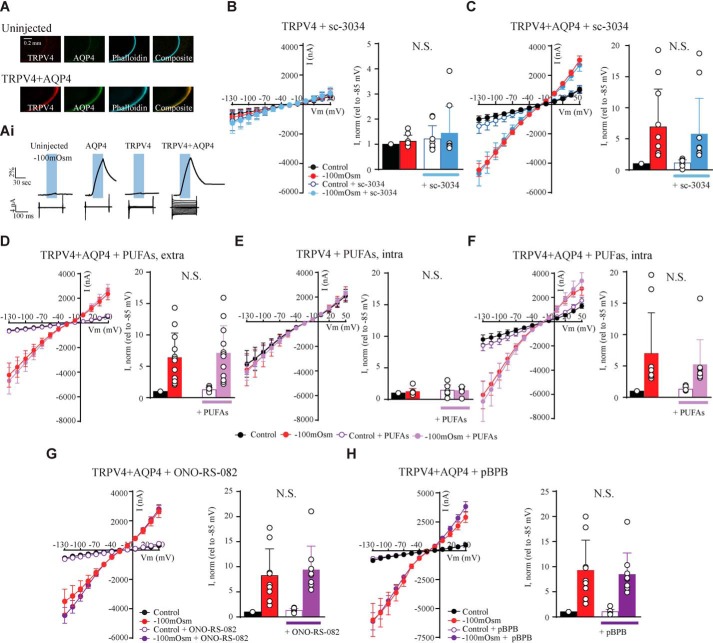
TRPV4 is activated by increased cell volume independently of PLA2 activity. A, representative confocal laser-scanning micrographs of an uninjected oocyte (top) and an oocyte expressing TRPV4 + AQP4 (bottom) after immunolabeling with phalloidin and anti-AQP4 and anti-TRPV4 antibodies confirmed the plasma membrane expression. Ai, representative volume and current traces obtained from oocytes voltage-clamped at Vm = −20 mV and challenged with a hyposmotic gradient (−100 mosm, indicated by a blue bar). Current traces were recorded with a 200-ms step protocol from an uninjected oocyte (far left) and oocytes expressing either AQP4 (middle left), TRPV4 (middle right), or TRPV4 + AQP4 (far right). B–H, summarized I/V curves from TRPV4– and TRPV4 + AQP4–expressing oocytes in control solution (black) or during application of a hyposmotic solution (red) without drug or in control solution and hyposmotic solution with sc-3034 (PLA2 activator) (B and C; control solution in white, hyposmotic solution in blue), externally added PUFAs (D; control solution in white, hyposmotic solution in light purple), microinjected PUFAs (E and F; control solution in white, hyposmotic solution in light purple), ONO-RS-082 (PLA2 inhibitor) (G; control solution in white, hyposmotic solution in dark purple), or pBPB (PLA2 inhibitor) (H; control solution in white, hyposmotic solution in dark purple). Insets, TRPV4-mediated current activity at −85 mV obtained after exposure to −100 mosm (red), in control solution with drug (white), and after exposure to −100 mosm with drug (blue, light, or dark purple) was normalized to that obtained in control condition without drug. N.S., not significant (p > 0.05); one-way ANOVA, n = 9–10 oocytes. Error bars, S.D. (bar graphs) or S.E. (I/V curves).

