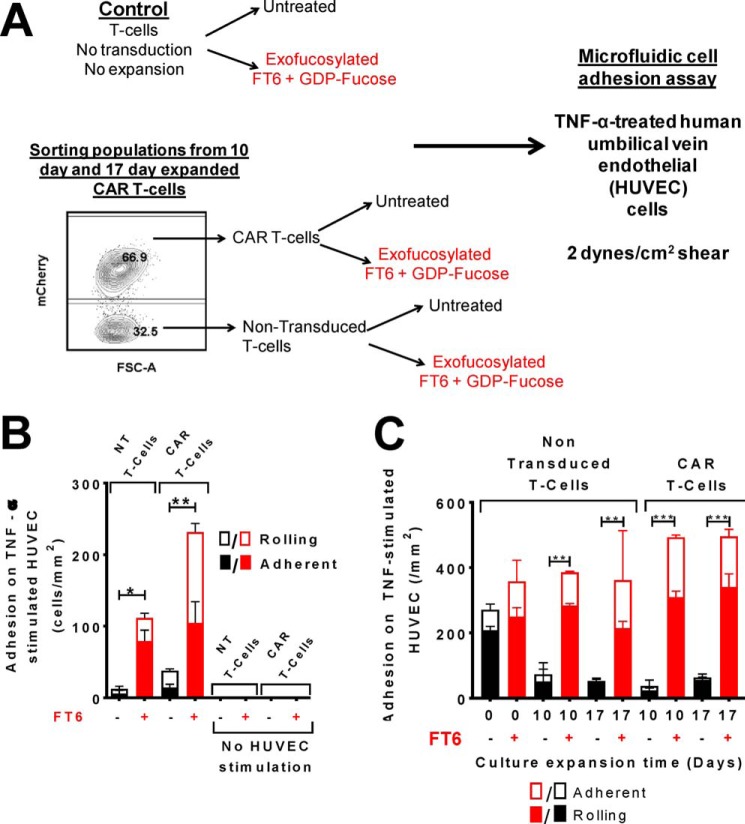
Figure 4.
Exofucosylation augments tethering and rolling function of culture-expanded CAR T-cells on TNFα-stimulated HUVECs. A, schematic of the experiment evaluating ex vivo tethering and rolling function of CAR-transduced and culture-expanded T-cells. T-cells were either treated with buffer alone (BT) or exofucosylated with FT6. The 10- and 17-day-expanded CAR-transduced T-cells were then flow-sorted based on mCherry expression to isolate NT (i.e. mCherry−) and CAR T-cells (i.e. mCherry+ cells). These cells were then perfused over a monolayer of TNFα-stimulated HUVECs at 2 dynes/cm2 shear stress at 2 × 10⁶/ml cell concentration. Rolling and adherent cells were counted and normalized to cell count per unit area. B, quantitation of E-selectin–mediated recruitment of BT (black columns) and FT6-treated (red columns) T-cell populations on TNFα-stimulated HUVECs. The plots present normalized counts of rolling (solid columns) and firmly adherent (open columns) T-cells. No T-cell rolling was observed in the absence of HUVEC stimulation. n = 2–3; ordinary one-way ANOVA (p = 0.01) with Sidak's multiple comparison test comparing BT with FT6-treated cells for each T-cell population: *, p < 0.05; **, p < 0.01. C, Column plot presenting normalized counts of rolling (solid columns) and firmly adherent (open columns) cells on HUVEC monolayers for native T-cells (nontransduced and nonexpanded, freshly isolated), NT T-cells (nontransduced and expanded), and CAR T-cells expanded for 0, 10, or 17 days in culture. Black columns represent BT T-cells, and red columns represent FT6-treated T-cells. Data represent mean ± S.E. of two independent experiments, triplicates. Ordinary one-way ANOVA (p = 0.0001) with Bonferroni's multiple comparison test comparing BT with FT6 categories for each T-cell population: **, p < 0.01; ***, p < 0.001.

