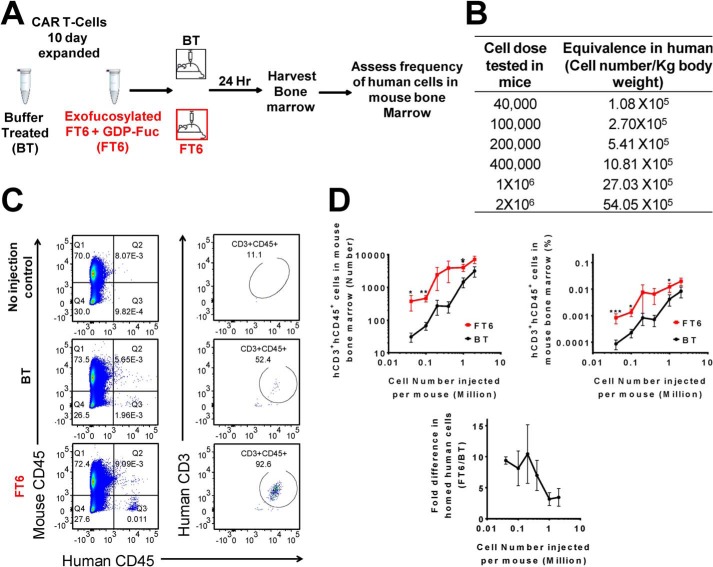
Figure 5.
Exofucosylation significantly improves CAR T-cell homing to bone marrow. A, schematic of CAR T-cell homing experiment. 10- or 17-day CAR T-cells were either treated with buffer alone (BT) or exofucosylated using FT6 (FT6). These cells were injected through the retro-orbital plexus of NSG mice at varying cell doses. 24 h after injection, mouse bone marrow (BM) was harvested and interrogated by flow cytometry. B, Number of cells in each category (BT or FT6) injected in individual mice, translated to number of cells per kilogram of body weight according to the following formula: human cell dose (cell number per kilogram) = mouse cell dose (cell number per kilogram) × (mouse Km/human Km) (24). C, representative dot plots showing flow cytometry analysis of mouse bone marrow. Bone marrow cells were co-stained with antibodies against mouse CD45 (mCD45), human CD45 (hCD45), and human CD3 (hCD3). mCD45− and hCD45+ cells (left) were subgated based on hCD3 expression (right) to identify hCD3 and hCD45 double-positive cells. Shown are bone marrow cells of mice receiving no human cell injection (top), 1 × 10⁶ BT CAR T-cells (center), and 1 × 10⁶ FT6-treated CAR T cells (bottom). Counting beads were used to calculate the absolute number of human cells in the bone marrow. D, quantitation of CAR T-cell marrow homing, presented as a function of injected cell number. Total number of bone marrow–infiltrating T-cells (top left), percentage of human cells in mouse bone marrow (top right), and -fold difference in homed human cells in mouse bone marrow (bottom), calculated as follows: -fold difference = percentage of hCD3+ hCD45+ FT6 cells in mouse BM/percentage of hCD3+ hCD45+ BT cells in mouse BM. Data are presented as mean ± S.E. of three independent experiments. Each data point represents three to four mice. Ratio-paired t test comparing BT and FT6 conditions for each cell dose: *, p < 0.05; **, p < 0.01.

