Figure 2.
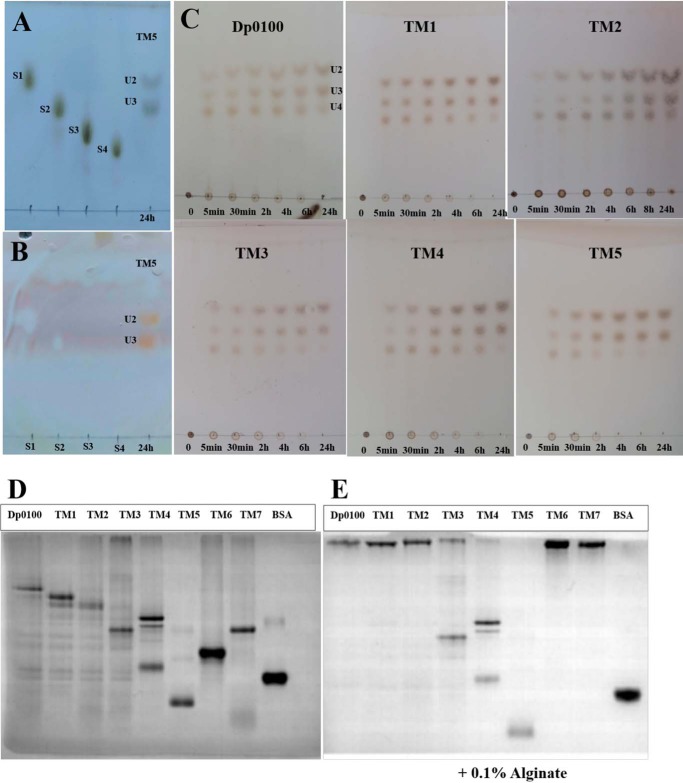
TLC analysis of the products released from alginate and affinity of Dp0100 and its TM1–TM7 constructs for soluble alginate by native affinity gel electrophoresis. A and B, marker sugars (1st lane, sodium d-mannuronate (S1); 2nd lane, sodium d-dimannuronate (S2); 3rd lane, sodium d-trimannuronate (S3); and 4th lane, sodium d-tetramannuronate (S4)) and the products of TM5 (unsaturated U2 and U3, 5th lane) after 24 h of incubation with alginate stained by the sulfuric acid/ethanol and TBA methods, respectively. Note that unsaturated sugars on the plate run faster than those of the equivalent saturated oligosaccharides (S1–S4) as reported previously (58, 59), and the saturated sugars are not stained by the TBA method (35, 59). C, unsaturated oligosaccharide products (U2, U3, and U4) of Dp0100 and TM1–TM5. 1st to 7th lanes represent incubation for 0, 5, and 30 min and 2, 4, 6, and 24 h, respectively. Plates in C were visualized by spraying with sulfuric acid in ethanol. D, 10% native-PAGE without alginate. E, 10% native-PAGE supplemented with 0.1% (w/v) alginate. 1st to 8th lanes represent Dp0100 and TM1–TM7 respectively; 9th lane contains BSA (0.2 μg) as a control.

