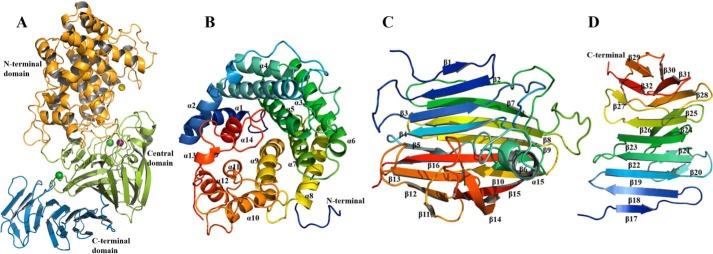
Figure 3.
Structure of the catalytic domain of Dp0100 (TM5). A, schematic diagram of the fold of TM5 showing its N-terminal (orange), central (green), and C-terminal domains (sky blue). The positions of the Mn2+, Ca2+, and Mg2+ ions are shown as purple, green, and yellow spheres, respectively. B–D, schematic diagrams of the N-terminal, central, and C-terminal domains drawn in a rainbow format (blue to red from the N to C termini) to show their secondary structure elements, which are labeled. Figure was prepared using PyMOL (56).

