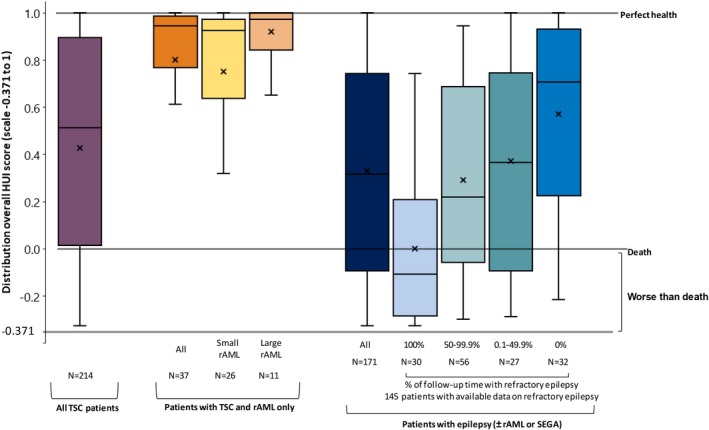
Figure 2.

Distribution of overall HUI, by the overall study sample and by study cohortsa. HUI, Health Utility Index; rAML, renal angiomyolipoma; SEGA, subependymal giant cell astrocytoma; TSC, tuberous sclerosis complex. aBox plots illustrate, from bottom up: 1.5 times less than first quartile, first quartile, median, third quartile and 1.5 times more than the third quartile value in the distribution. "x" shows the mean of the distribution
