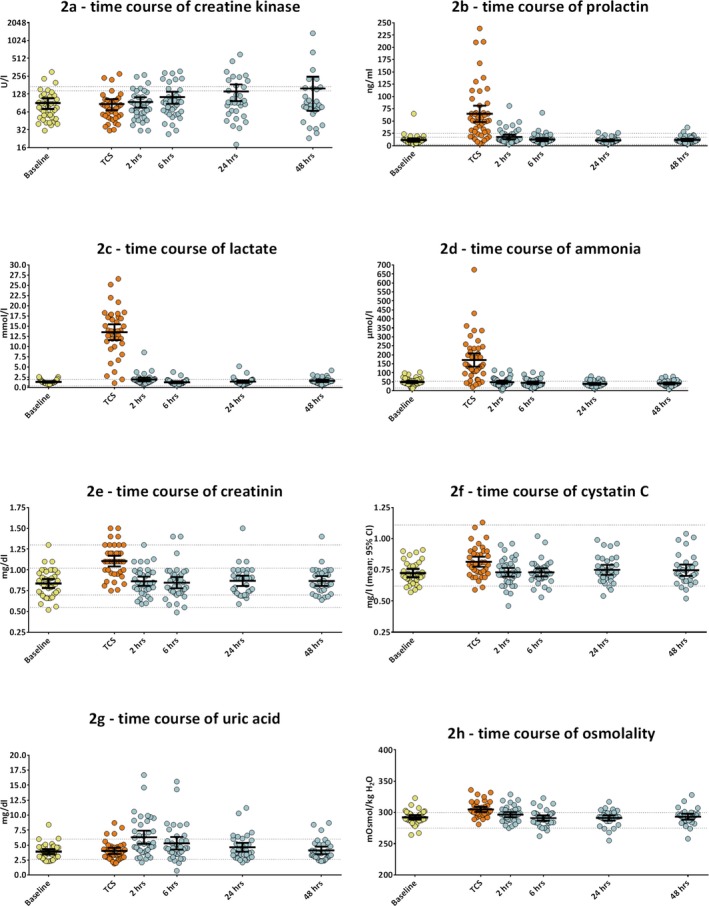
Figure 2.

(A‐H) Time course of laboratory values after TCS. All measurements are plotted and used to calculate percentages of elevations, but only complete measurements were used for repeated measures ANOVA. Bars represent means with 95% confidence intervals. The y‐axis in (A) presents the binary logarithm of CK activity in units per liter. All other y‐axes present the concentration of the measured molecules in linear units. Dots present individual measurements. The dotted lines in (A) present the upper limit of normal (ULN) for women (lower line) and men (upper line). The dotted lines in (B) present the ULN for women (upper line) and men (middle line) as well as the lower limit of normal (LLN) for both sexes (lowest line). In (E), the dotted upper lines represent the ULN for men (1.3 mg/dL) and women (1.02 mg/dL), and the lowest dotted line represents the LLN for women and the remaining line represents the LLN for men. In all other figures, the dotted lines present the ULN and LLN for both sexes
