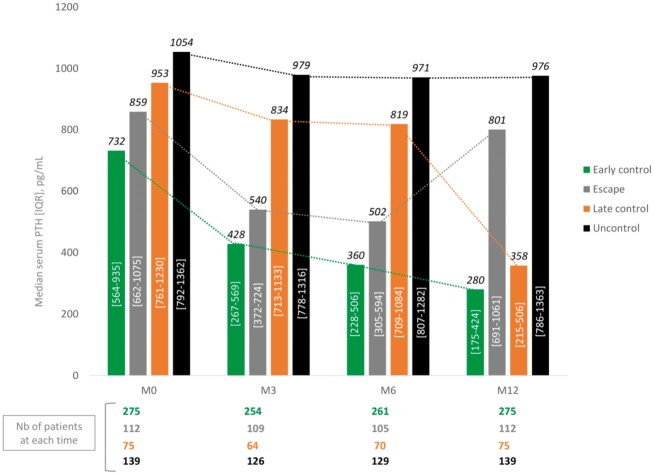
FIGURE 4.
Four different PTH trajectories. This figure shows the course of mean serum PTH levels for four different groups of patients: those who were rapidly controlled, those who were rapidly controlled but escaped after 6 months of treatment, those with late control and those who remain uncontrolled during 12 months of treatment.

