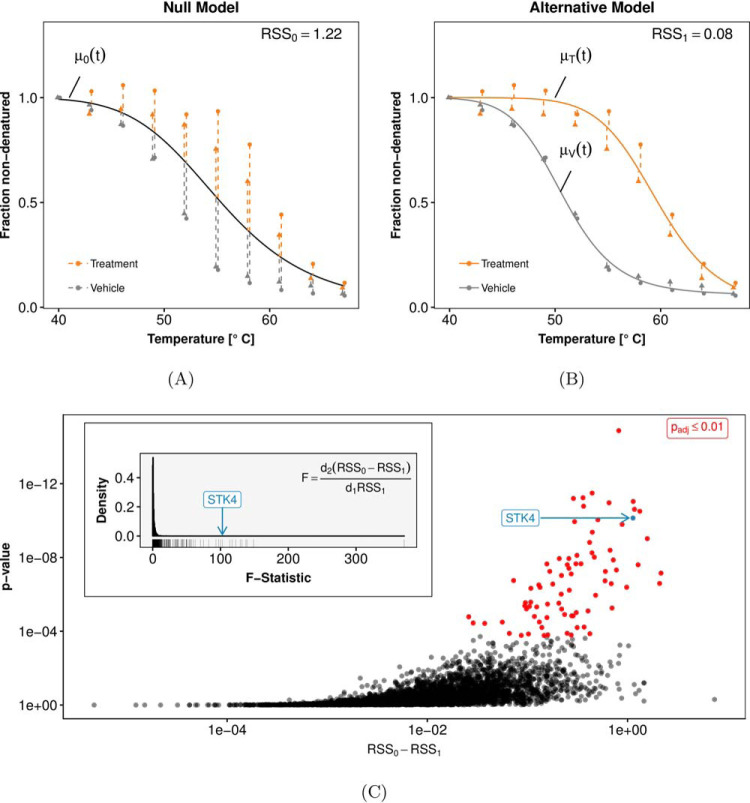
Fig. 2.
Principles of NPARC, illustrated for protein STK4 under staurosporine treatment. A, Fit of the null model, i.e. no treatment effect (black line). The goodness-of-fit is quantified by RSS0, the sum of squared residuals (dashed lines). As in Fig. 1, the triangle and circle symbols indicate the experimental replicates. B, Fit of the alternative model, with separate curves for the treated (orange) and the vehicle condition (gray). Because of the higher flexibility of the model, the sum of squared residuals RSS1 is always less than or equal to RSS0. C, The question whether the improvement in the goodness-of-fit, i.e. the difference RSS0 − RSS1, is strong enough to reject the null hypothesis can be addressed with the variant of the F-test described in the main text. Each point in the plot corresponds to a different protein. The highlighted example STK4 has a large F-statistic and a small p value.

