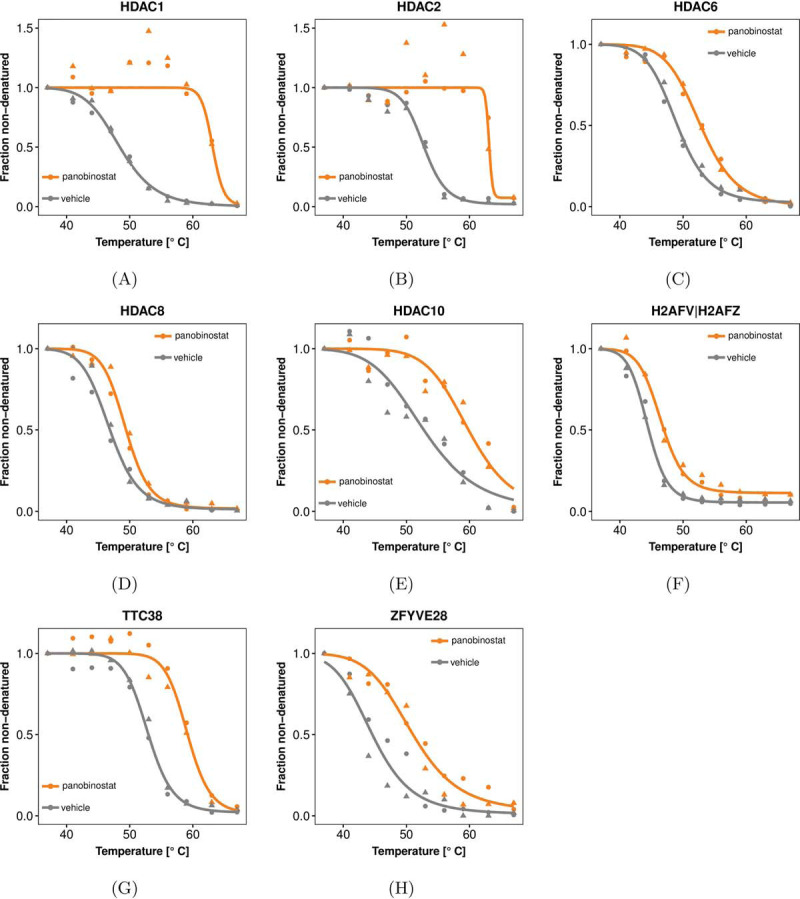
Fig. 3.

Direct and indirect targets of the HDAC inhibitor panobinostat detected by NPARC (FDR ≤ 0.01 according to the method of Benjamini and Hochberg (26)). A–E, Data and curve fits for five HDACs that show significant shifts in their thermostability. HDAC1 and HDAC2 are not detected by the Tm-based approach of (6), because the higher variance between the replicates of the panobinostat-treated condition leads to them being eliminated by the filter heuristics of that method (Table III). In contrast, NPARC naturally takes the variance into account in the computation of the F-statistic and does not require such filtering steps. F–H, Data and curve fits for known non-HDAC targets.
