Fig. 2.
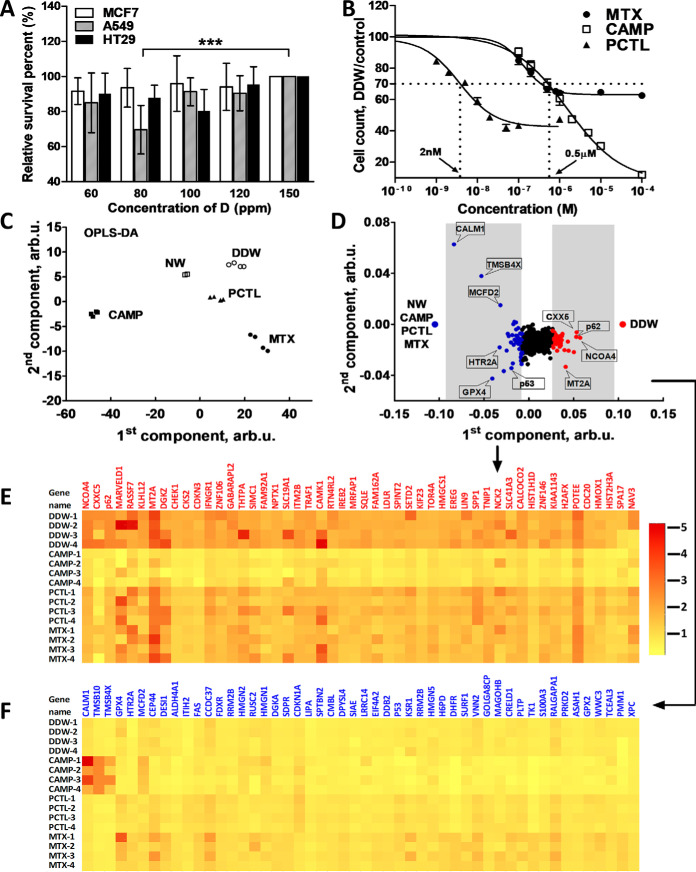
Determination of the most sensitive to DDW cell line and FITExP analysis at the deuterium concentration of maximum suppression. A, Survival of MCF7, A549 and HT29 cell lines grown in media with different deuterium concentrations. B, Inhibition curves of CAMP, PCTL and MTX, and determination of IC30. C, OPLS-DA of protein abundances for different treatments at IC30. D, Loading scatter plot of OPLS-DA reveals the top 50 upregulated proteins (red dots) and the top 50 downregulated proteins (blue dots) specific for DDW treatments. (E, F) Heat map of top 50 specifically up- (E) and downregulated (F) proteins in DDW treatment. A and B show the mean ± SEM of four independent experiments, single measurement, *** p < 0.005 in two-way ANOVA with post hoc t test.

