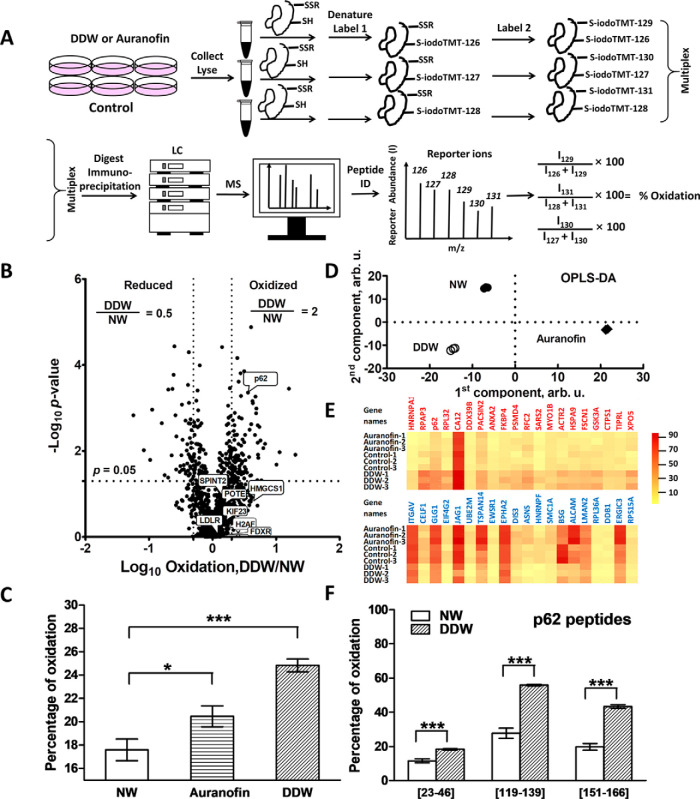
Fig. 3.
Redox proteomics analysis of the DDW effect. A, Redox proteomics workflow. B, Volcano plot for cells treated with DDW compared with NW. Lines indicate differences of 2 in mean ratios and p value of 0.05 in two-tailed unparied t test. C, Average oxidation levels of cells grown in NW, auranofin and DDW. D, OPLS-DA of redox proteomics data. E, Heatmap of 20 most oxidized (above) and reduced (below) proteins in cells grown in DDW. F, Oxidation levels of p62 peptides in DDW versus NW control. B shows the mean of three independent experiments. The columns in C and F show the mean ± SEM in three independent experiments; * p < 0.05, *** p < 0.005 in two-tailed unpaired t test.

