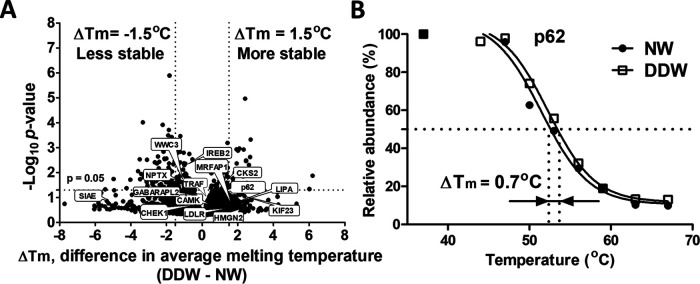
Fig. 4.
Changes in thermal stability of proteins upon DDW treatment. A, Volcano plot of melting temperature shifts compared with NW control. Lines indicate a difference in average melting temperature of ≥ 1.5 °C and p value of 0.05 (-Log10 = 1.3) in two-tailed unparied t test. B, Example of p62 melting temperatures. A, B Based on average of two independent experiments, single measurement.

