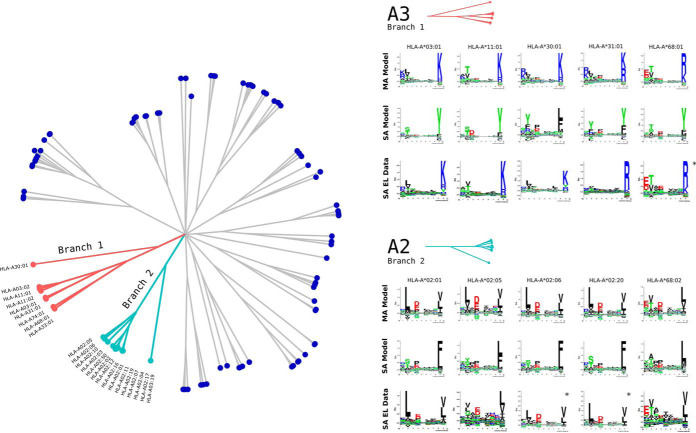
Fig. 4.
HLA supertype pruning experiment. The left panel shows a functional tree of HLA specificities estimated using MHCcluster (63). Branches in light blue and red correspond to the A2 and A3 HLA supertypes. In the HLA supertype tree pruning experiment, SA data for HLA molecules belonging to both these branches were removed. Right panel shows binding motifs for A2 and A3 supertype alleles from the MA EL data set predicted by the MA and SA models. Motifs were constructed from the top 1% of 1,000,000 random natural 9mer peptides predicted by each model. SA EL data show motifs derived from SA EL data (not included in the training). For alleles marked with * no SA EL data was available and motifs were obtained from NetMHCpan from http://www.cbs.dtu.dk/services/NetMHCpan/logos_ps.php.

