
Figure 1. Senescent melanocytes accumulate in human skin with age.
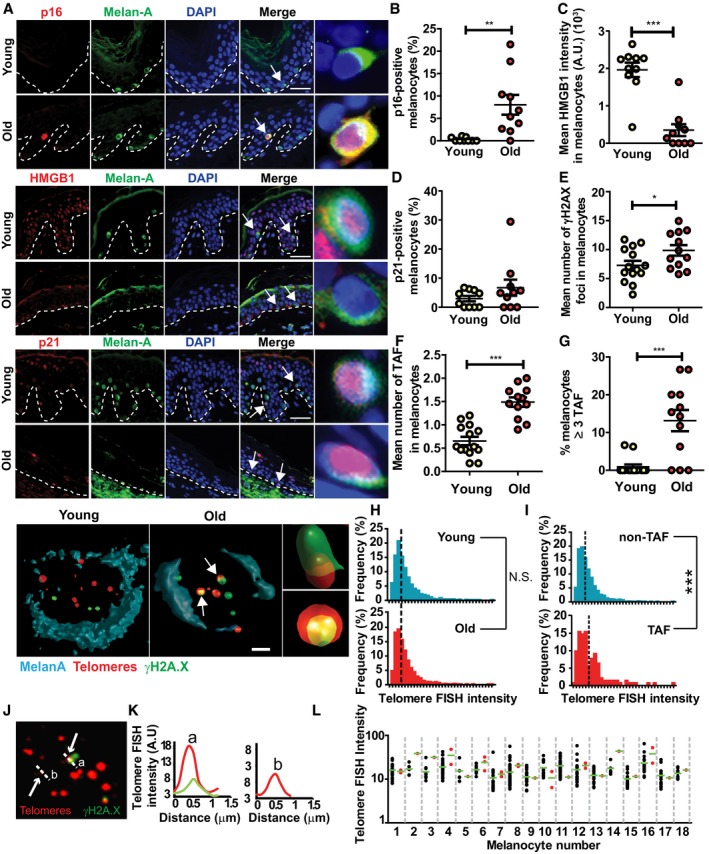
Immunofluorescence was performed in skin biopsies from young and old human donors for the analysis of senescence markers.
-
ARepresentative immunofluorescence images for p16, HMGB1 and p21 together with Melan‐A in young and older skin. Arrows indicate melanocytes, which are amplified on the right. Scale bar is 30 μm. Bottom panel shows representative immuno‐FISH images for γH2AX (green) and telomeres (red) in melanocytes in young and older skin sections. Arrows indicate co‐localisation between γH2AX foci and telomeres (TAF), which are amplified on the right. Images are 3D reconstructions of immuno‐FISH using confocal microscopy and taken with a 100× oil objective. Scale bar is 10 μm.
-
B–GDot plots show (B) percentage of p16‐positive melanocytes, (C) mean HMGB1 intensity in melanocytes, (D) percentage of p21‐positive melanocytes, (E) mean number of γH2AX foci, (F) mean number of TAF in melanocytes and (G) percentage of melanocytes containing ≥ 3 TAF for each individual subject (n = 10–14 young and 10–12 old donors). The horizontal line represents the mean for each group ± SEM.
-
HHistograms showing distribution of telomere signal intensities in melanocytes analysed by Q‐FISH in young (n = 8) and old (n = 7) skin biopsies. Dotted lines indicate median intensity.
-
IHistograms showing distribution of intensities of γH2AX‐negative (non‐TAF) and γH2AX‐positive (TAF) telomeres in melanocytes in older skin (n = 8 donors). Dotted lines indicate median intensity.
-
JRepresentative immuno‐FISH image (red: telomeres; green: γH2AX) of a melanocyte in the skin of an older donor, showing a longer telomere co‐localising with γH2AX (a) and a shorter one which is γH2AX‐negative (b). Arrows indicate telomeres measured in (K), and dashed lines show the area quantified in (K). Images are Huygen (SVI) deconvolved Z projections and were taken using a 100× oil objective.
-
KGraphs showing the quantification of telomere intensity of γH2AX‐positive (a) and γH2AX‐negative (b) telomeres. Red line indicates telomere intensity, and green shows γH2AX intensity.
-
LGraph showing FISH intensities for individual telomeres co‐localising (TAF; red) or not co‐localising (non‐TAF; black) with γH2AX foci in individual melanocytes (n = 18). Green horizontal line indicates the mean FISH intensity.