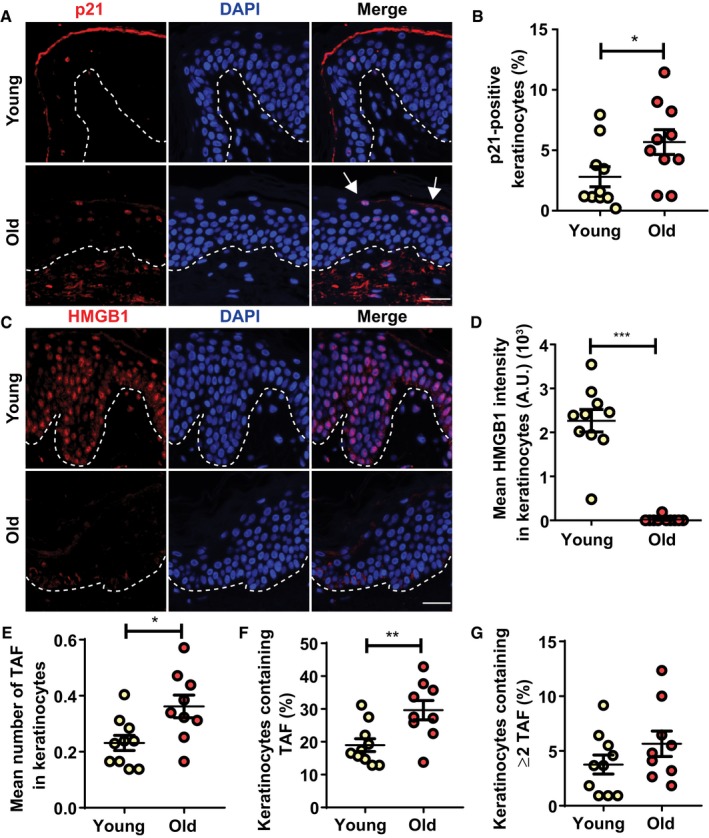
Figure EV3. Keratinocytes express senescence markers in human skin with age.

-
A–DRepresentative immunofluorescence images of (A) p21 and (C) HMGB1 in skin from young and old donors. Images were taken using a 20× objective. Arrows indicate p21‐positive keratinocytes in the uppermost layer of the epidermis. Scale is 30 μm. Graphs showing (B) percentage of p21‐positive keratinocytes per donor and (D) HMGB1 intensity in keratinocytes. The horizontal line represents the mean for each group (n = 10 donors per group). Data are shown as mean ± SEM.
-
E–G(E) Mean number of TAF in keratinocytes, (F) percentage of keratinocytes containing TAF and (G) percentage of keratinocytes containing ≥ 2 TAF in skin sections from young and old donors. The mean for each group is represented by the horizontal line (n = 10 young donors; n = 9 old donors). Data are shown as ± SEM.
