
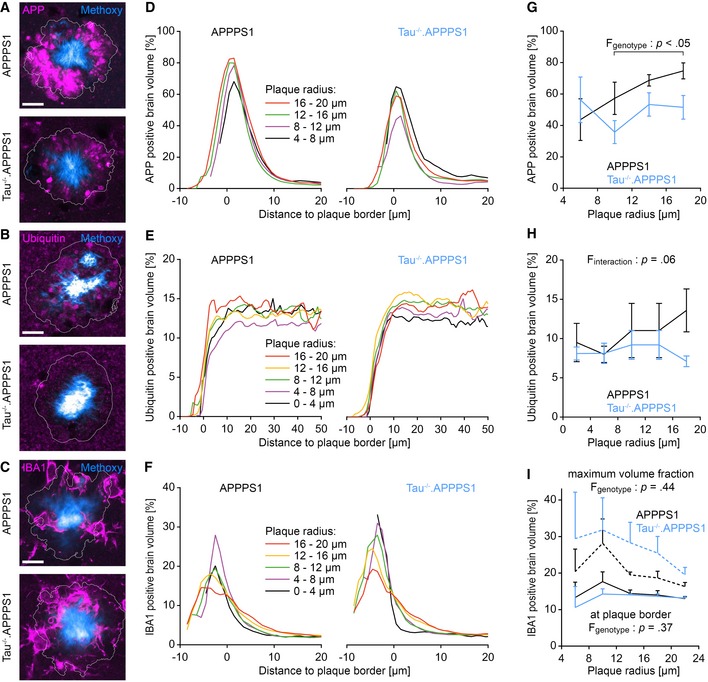
Figure 5. Tau deletion reduces accumulation of APP in peri‐plaque dystrophies.
-
A–CImmunofluorescence micrographs indicating the expression pattern of (A) APP (APPY188‐specific antibody), (B) ubiquitin, and (C) IBA1 around Methoxy‐X04‐stained plaques in 7.5‐month‐old mice. White lines indicate the plaque border as defined by Methoxy‐X04 fluorescence. Scale bar represents 10 μm.
-
D–FFraction of (D) APP, (E) ubiquitin, and (F) IBA1 immunopositive brain volume at varying distances to the closest plaque border for plaques of different radii. Data presented as mean.
-
GFraction of APP‐positive brain volume within the outmost plaque layer (−1 to 0 μm). Data presented as mean ± SEM; mixed‐design ANOVA genotype F 1,6 = 7.54, P = 0.033; Bonferroni's post hoc test; n APPPS1 = 4, n Tau−/−.APPPS1 = 4 mice; mean plaque number analyzed per mouse: 15.
-
HFraction of ubiquitin‐positive brain volume between 1 and 6 μm from plaque borders. Data presented as mean ± SEM; mixed‐design ANOVA interaction genotype × plaque radius F 2.2,19.5 = 3.28, P = 0.056, rank transformation was performed to reduce heteroscedasticity; n APPPS1 = 6, n Tau−/−.APPPS1 = 5 mice; mean plaque number analyzed per mouse: 50.
-
ISolid lines indicate the fraction of IBA1‐positive brain volume within the outmost plaque layer (−1 to 0 μm; mixed‐design ANOVA genotype F 1,6 = 0.93, P = 0.37). Dashed lines indicate the maximum IBA1‐positive volume fraction within plaques (mixed‐design ANOVA genotype F 1,6 = 0.69, P = 0.44). Data presented as mean ± SEM; n = 4 mice per cohort; mean plaque number analyzed per mouse: 30.
Source data are available online for this figure.