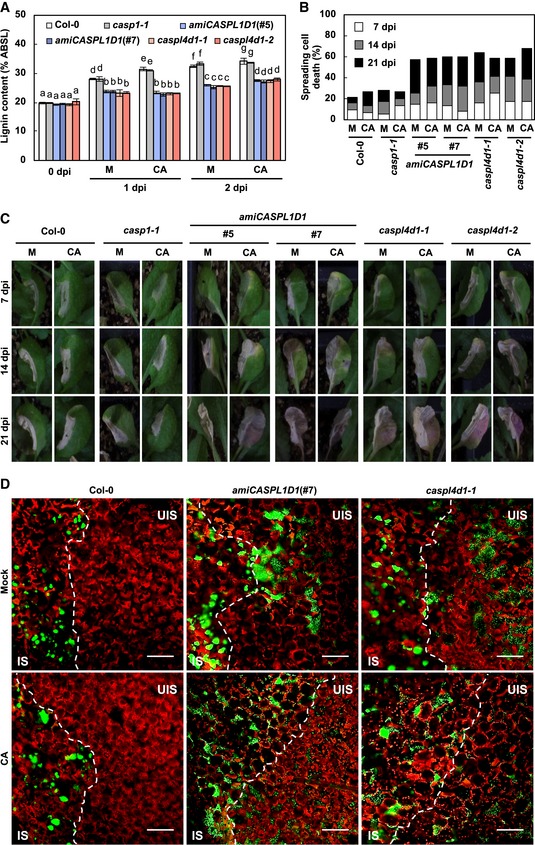
Quantification of lignin content in CA‐pretreated wild‐type and caspl leaves after Pst DC3000 (AvrRpm1) inoculation. Data are shown as means ± SD (n = 4; 3–9 leaves each). Different letters indicate significant differences (Tukey's HSD test; P < 0.05).
Quantification of leaves (n ≥ 30) with spreading cell death after Pst DC3000 (AvrRpm1) inoculation.
Cell death phenotypes of leaves inoculated with Pst DC3000 (AvrRpm1).
Colonization patterns of GFP‐Pst DC3000 (AvrRpt2). Bacterial inoculum was at 108 cfu/ml. IS, infected site; UIS, uninfected site. White dash lines indicate the boundary between IS and UIS. Scale bars, 100 μm.
Data information: M, mock; CA, coniferyl alcohol; dpi, days post‐inoculation.

