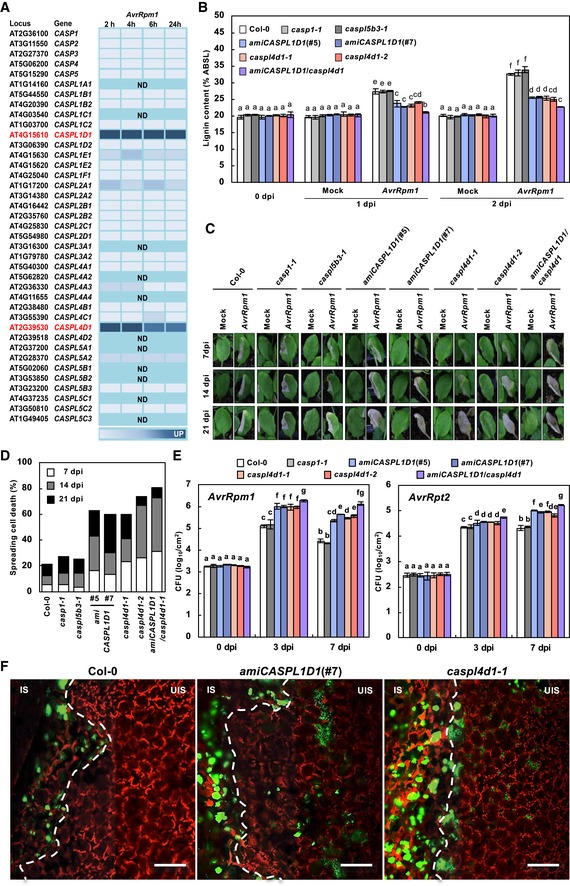
Time course expression profiles of
CASPLs in response to
Pst DC3000 (
AvrRpm1) treatment. Analysis was based on the Genevestigator database (
http://www.genevestigator.ethz.ch/). The darker color corresponds to stronger expression. ND, not determined.
Quantification of lignin content in wild‐type and caspl mutant leaves after Pst DC3000 (AvrRpm1) inoculation. Data are shown as means ± SD (n = 4; 3–9 leaves each).
Cell death phenotypes of leaves inoculated with Pst DC3000 (AvrRpm1).
Quantification of leaves (n ≥ 30) with spreading cell death after Pst DC3000 (AvrRpm1) inoculation.
Measurements of Pst DC3000 (AvrRpm1) and Pst DC3000 (AvrRpt2) growth. Data are shown as means ± SD (n = 3).
Colonization patterns of GFP‐Pst DC3000 (AvrRpt2) in caspl mutant plants. IS, infected site; UIS, uninfected site. White dash lines indicate the boundary between IS and UIS. Scale bars, 100 μm.
Data information: Different letters indicate significant differences (Tukey's HSD test;
P <
0.05). Experiments were repeated three times with similar results.
AvrRpm1,
Pst DC3000 (
AvrRpm1);
AvrRpt2,
Pst DC3000 (
AvrRpt2); dpi, days post‐inoculation.

