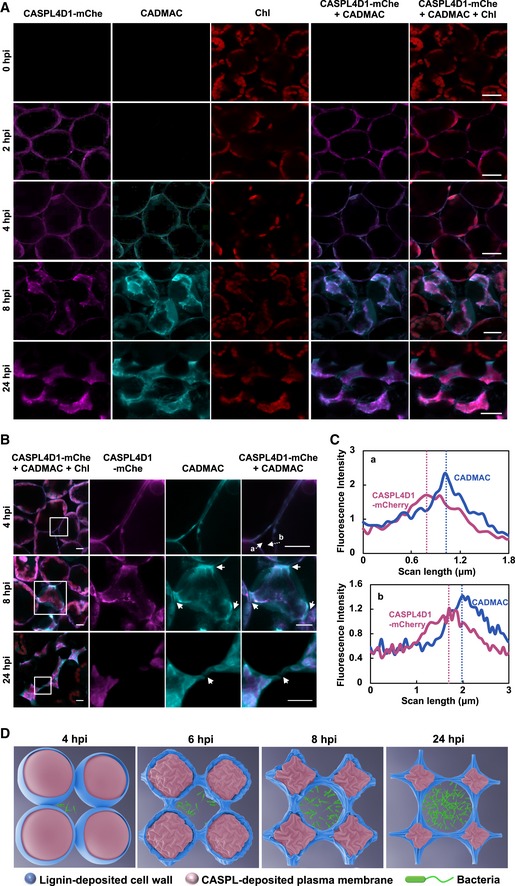
Visualization of CASPL4D1 proteins and lignin by mCherry and CADMAC fluorescence.
Magnified views of CASPL4D1 and lignin localization. Images in boxes were enlarged in the 2nd to 4th columns. Arrows indicate lignin deposition between cells.
Relative fluorescence intensity profiles of CASPL1D1 (mCherry) and lignin (CADMAC) across transects indicated by dotted lines and letters (a, b) in (B).
A model showing morphological changes of CASPL‐ and lignin‐deposited cells during the HR response.
Data information:
pCASPL4D1::CASPL4D1‐mCherry plants were pretreated with CADMAC and then inoculated with
Pst DC3000 (
AvrRpm1). mCh, mCherry; Chl, chlorophyll; hpi, hours post‐inoculation. Scale bars, 20 μm (A), 10 μm (B).

