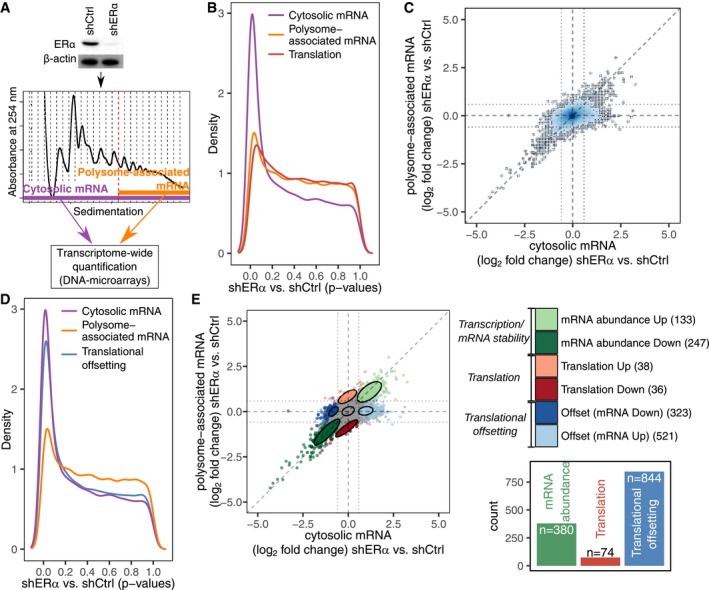
Figure 1. ERα‐dependent alterations in steady‐state mRNA levels are largely offset at the level of mRNA translation.

-
AExpression of ERα in control (shCtrl) and knockdown (shERα) BM67 cells was determined by Western blotting (β‐actin served as a loading control). Gene expression was determined using polysome profiling which quantifies both total mRNA and efficiently translated polysome‐associated mRNA (n = 3).
-
BDistributions (quantified by kernel density estimation) of P‐values for differential expression (shERα vs. shCtrl BM67 cells) using data from polysome‐associated mRNA (orange), cytosolic mRNA (purple) or from analysis of changes in translational efficiency (i.e., changes in polysome‐associated mRNA not paralleled by changes in cytosolic mRNA) leading to altered protein levels (red; a higher density of low P‐values indicates a higher frequency of changes in gene expression).
-
CScatter plot of polysome‐associated mRNA vs. cytosolic mRNA log2 fold changes (shERα vs. shCtrl). Areas of the plot are colored according to the density of data points [genes; dark blue corresponds to areas with many genes (see Appendix Supplementary Methods)].
-
DSame plot as in (B) but including a blue density of P‐values from the analysis of translational offsetting.
-
EA scatter plot similar to (C) but where genes are colored according to their mode of regulation derived from anota2seq analysis. A relaxed threshold (P < 0.05) was used to identify a set of transcripts regulated via translation, which did not pass thresholds used for identification of changes in mRNA abundance or translational offsetting (FDR < 0.1). Confidence ellipses (level 0.7) are overlaid for each mode of regulation. A bar graph indicates the number of mRNAs regulated via each mode.
Source data are available online for this figure.
