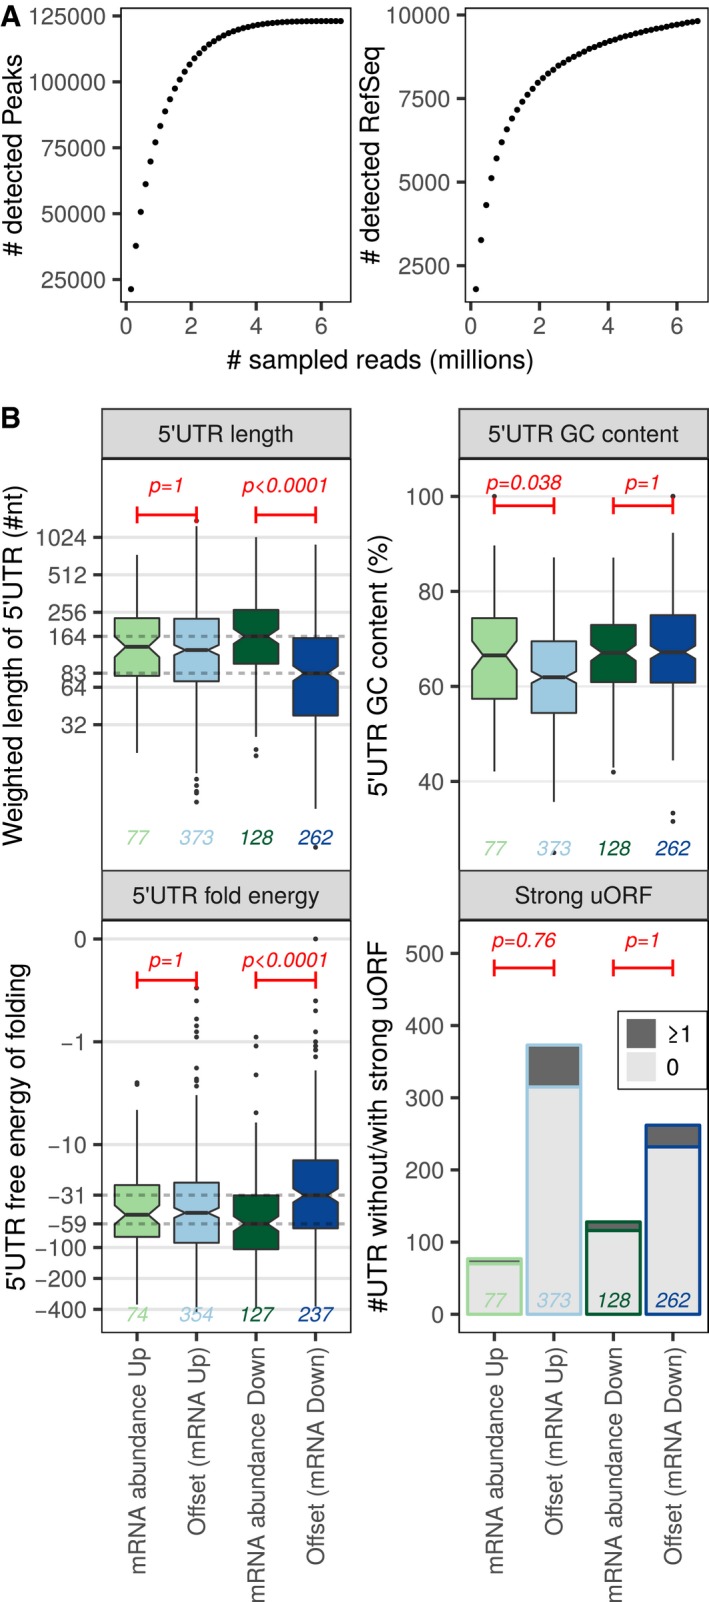
Figure 3. Genes repressed upon ERα depletion but translationally offset have short and less stable 5′ UTRs.

-
AnanoCAGE sequencing was applied to determine transcription start sites in shERα BM67 cells. The number of detected transcription start sites (peaks) and RefSeq transcripts when sampling increasing number of RNAseq reads are indicated to evaluate the complexity of nanoCAGE RNAseq libraries.
-
BBoxplots for offset and non‐offset mRNAs comparing 5′ UTR weighted lengths (log2 scale), GC content (%), free energy (log10 scale, kcal/mole). In boxplots, the solid horizontal middle line is the median; the lower and upper box limits correspond to the first and third quartiles; the whiskers extend from the box limits to the most extreme value but not further than ± 1.5 × the inter‐quartile range (IQR) from the box limits. The notches extend to 1.58 × the IQR/√n where n is the number of data points. Data beyond the end of the whiskers are plotted as points. Wilcoxon–Mann–Whitney tests (two‐sided) were used to assess differences between translationally offset and non‐offset mRNAs. Number of transcripts harboring at least one (dark gray) or no (light gray) uORF in a strong Kozak context were visualized as a bar chart and differences were tested using one‐sided Fisher's exact tests. A global Bonferroni adjustment was applied on P‐values. Analysis was performed on nanoCAGE data from three replicates of shERα BM67 cells; the numbers of transcripts in each group are indicated in the figure.
