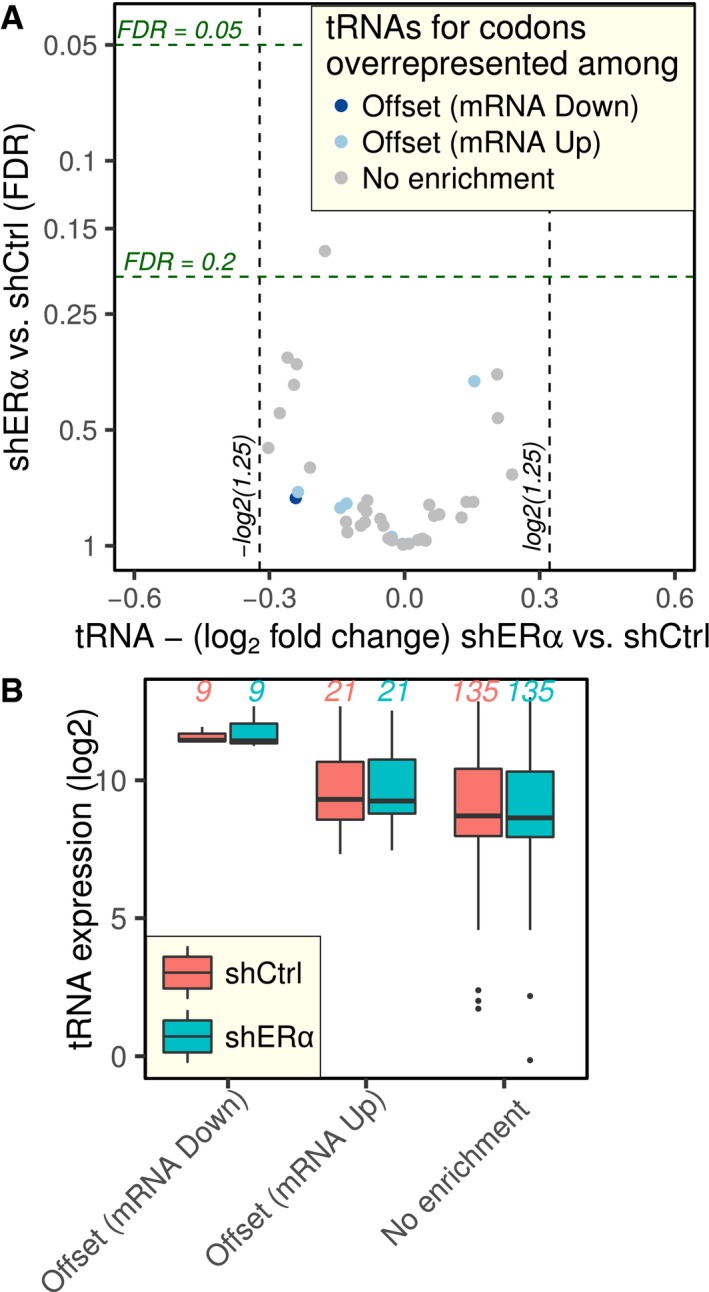
Figure EV4. ERα depletion‐associated translational offsetting cannot be explained by modulations of tRNA levels.

-
AVolcano plot of changes in tRNA level (shERα vs. shCtrl). Each tRNA is colored according to the mode for regulation of gene expression it is enriched in.
-
BtRNAs were grouped according to the mode for regulation of gene expression they are enriched in, and their expression is compared using boxplots (plotted as in Fig 3B). The numbers of tRNAs in each group are indicated in the figure.
