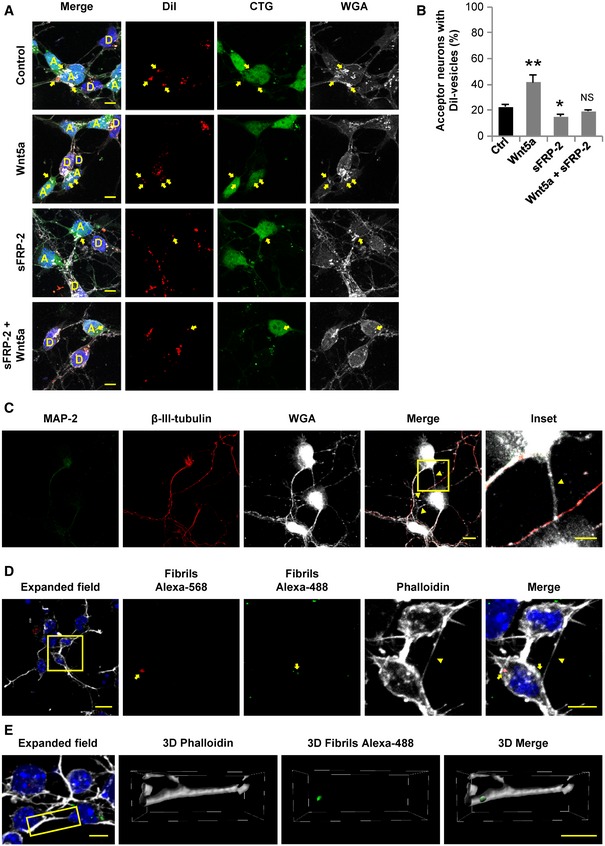
Representative confocal images of co‐cultured donor (D, labeled with DiI) and acceptor (A, labeled with CTG) neurons treated or not with 200 ng/ml of Wnt5a, 200 ng/ml sFRP‐2 or 200 ng/ml Wnt5a plus 200 ng/ml sFRP‐2 for 4 h. Yellow arrows point to DiI‐labeled vesicles inside acceptor neurons.
Percentage of acceptor neurons containing DiI‐labeled vesicles after being co‐cultured with donor neurons and incubated for 4 h with the indicated treatments.
Primary cortical neurons at 1 DIV were fixed and labeled with MAP‐2 (green), β‐III‐tubulin (red), and WGA (white). The inset shows a magnified image of the area depicted in the merged panel. Yellow arrowheads point out TNT‐like structures.
Transfer of α‐syn fibrils is shown in neurons at 1 DIV. Cells were loaded in suspension with either Alexa‐568 α‐syn fibrils (red) or Alexa‐488 α‐syn fibrils (green) and cultured together. The insets (right panels) show a magnification of the area depicted in the expanded field image (left). Yellow arrows point to red and green α‐syn puncta contained in the soma of a neuron. Yellow arrowhead points to a TNT‐like connection.
A TNT‐like connection containing Alexa‐488 α‐syn‐positive puncta is found in neurons at 1 DIV stained with phalloidin (white) and DAPI (blue). The insets (right panels) show the 3D reconstruction of the area depicted in the expanded field image (left).
Data information: In (A, C, D, E), scale bars in the expanded fields represent 10 μm and 5 μm in the insets. In (B) graphs represent the average of three independent experiments showing mean ± SEM. Statistical significance was calculated with respect to control (Ctrl); *
P ≤
0.05; **
P ≤
0.01, NS = not significant (one‐way ANOVA).

