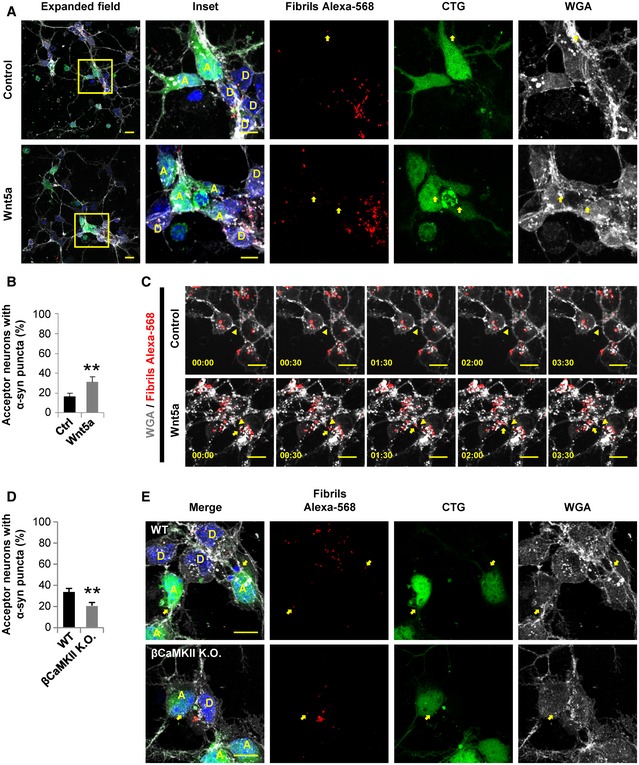
Representative confocal images of 1 DIV co‐cultured donor (D, loaded with Alexa‐568 α‐syn fibrils) and acceptor (A, labeled with CTG) neurons. After 20 h post‐plating, neurons were treated with 200 ng/ml Wnt5a for 4 h. The insets (right panels) show a magnification of the area depicted in the expanded field (left). Yellow arrows point to α‐syn puncta inside acceptor neurons.
Percentage of acceptor neurons containing α‐syn puncta for each of the indicated treatments.
Time lapses of neurons loaded with Alexa‐568 α‐syn fibrils and cultured in control conditions or treated with 200 ng/ml Wnt5a. Neuron‐to‐neuron transfer of α‐syn puncta (yellow arrows) through a TNT‐like structure (yellow arrowheads) is shown upon Wnt5a treatment.
Percentage of acceptor neurons containing α‐syn puncta in WT or βCaMKII K.O. acceptor neurons.
Representative confocal images of 1 DIV co‐cultured donor (D, loaded with Alexa‐568 α‐syn fibrils) and acceptor (A, labeled with CTG) neurons. Neurons were obtained from WT or βCaMKII K.O. mice. Yellow arrows point to α‐syn puncta inside acceptor neurons in both conditions.
Data information: In (A, C, E), scale bars represent 10 μm. In (B, D) graphs show mean ± SEM of 123–250 acceptor neurons analyzed per condition. Statistical significance was calculated with respect to control (Ctrl, in B) or WT (in D); **
P ≤
0.01, NS = not significant (Student's
t‐test).

