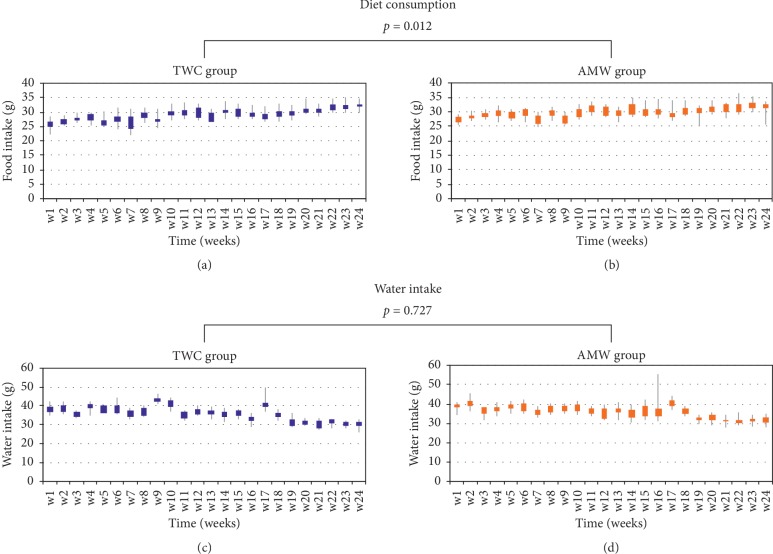
Figure 2.
Fluctuation of weekly diet and water consumption in either TWC or AMW ingestion group. The average amount of diet consumed each week was calculated for each group of C57BL6/J mice (N = 10, kept in SPF conditions, see Section 2). Diet consumption of the control TWC (a) and the testing AMW groups (b), or water intake in TWC (c) and AMW groups (d). The statistical significance of each criterion was evaluated by ANOVA and indicated as p values.

