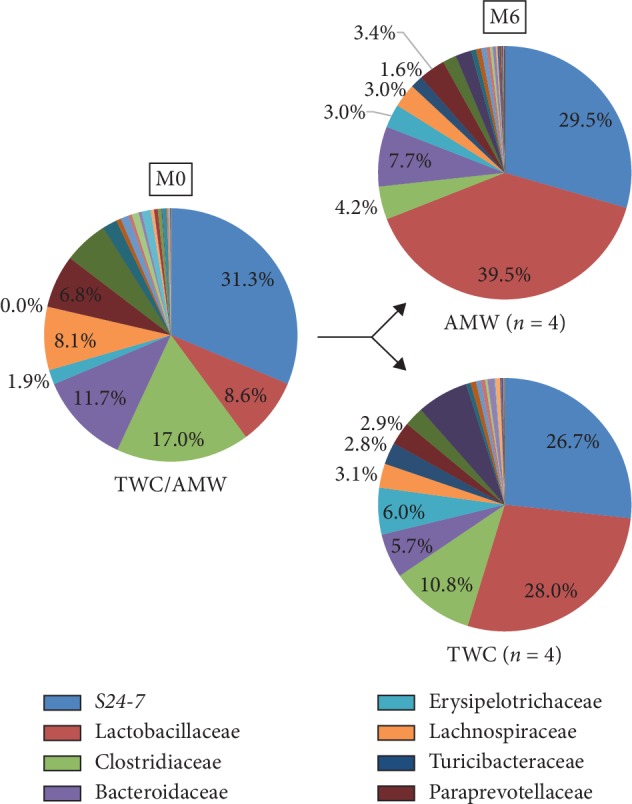
Figure 4.

Comparison of fluctuation in properties of gut microbiota population between TWC and AMW groups. Feces collected from ICR mice in both TWC and AMW groups were analyzed with metagenomic sequencing analysis of 16S-rRNA as indicated in Section 2. Proportions of each bacterium at the level of family identified at M0 and M6 are shown in pie charts.
