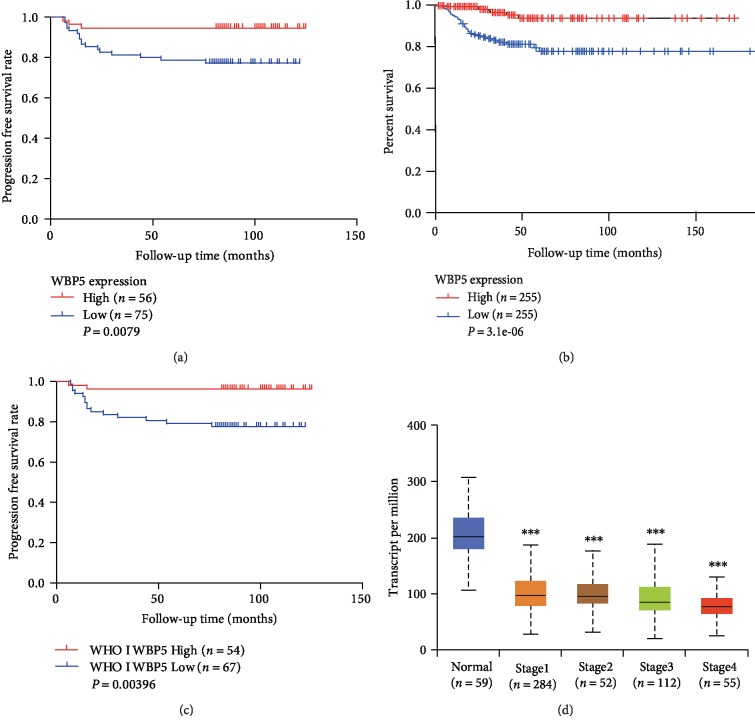
Figure 2.
Kaplan–Meier curve and bioinformatics analyses of WBP5 expression. (a) WBP5 expression was significantly correlated with DFS in PTC (P < 0.05). (b) Association between WBP5 expression level and DFS in patients with PTC based on the gene expression profiling interactive analysis (GEPIA). Patients with PTC with a high WBP5 had longer DFS than those with low WBP5 expression (P < 0.05). (c) WBP5 expression was significantly correlated with the WHO grade I prognosis in PTC (P < 0.05). (d) The expression of WBP5 at different stages of PTC in the UALCAN database. ∗∗∗P ≤ 0.001, two-sided unpaired t-test.

