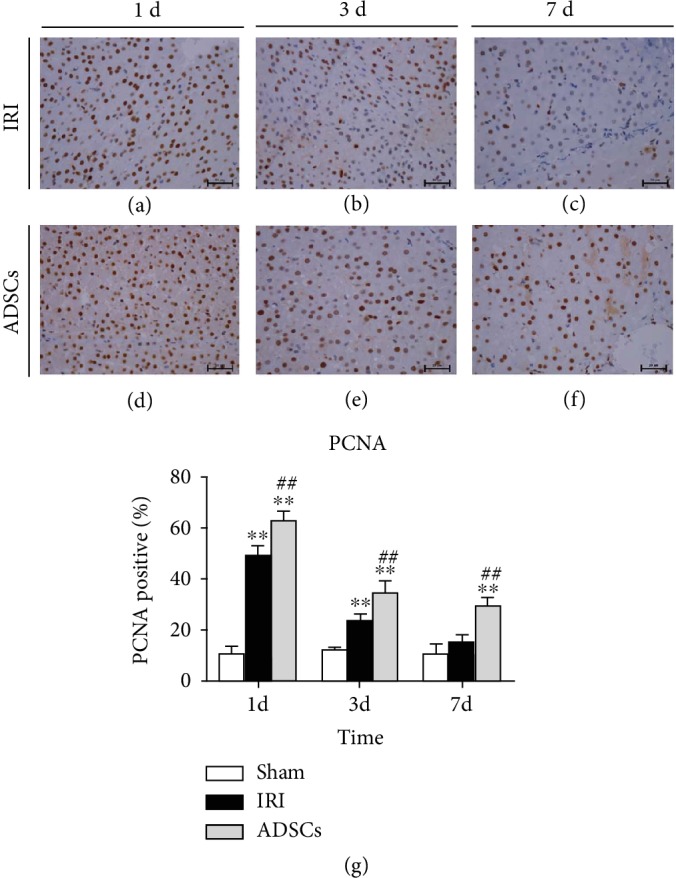
Figure 7.

Effect of ADSCs on PCNA expression. Representative IHC images showing in situ PCNA expression in the (a–c) IRI and (d–f) ADSC groups at day 1, 3, and 7. (g) Percentage of PCNA-positive cells in the different groups. IRI: ischemia-reperfusion injury; ADSCs: adipose-derived mesenchymal stem cells. ∗P < 0.05, ∗∗P < 0.01, versus the sham group. #P < 0.05, ##P < 0.01, versus the IRI group.
