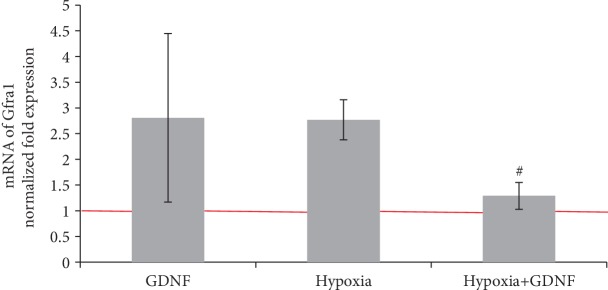
Figure 7.
Features of Gfra1 gene expression encoding the GFRα receptor on day 1 of the posthypoxic period. Data are normalized to the reference gene (Oaz1) and represent the mean values ± SEMs from three independent experiments. Statistical significance was calculated by one-way ANOVA; p < 0.05; ∗versus “Sham”; #versus “Hypoxia”.

