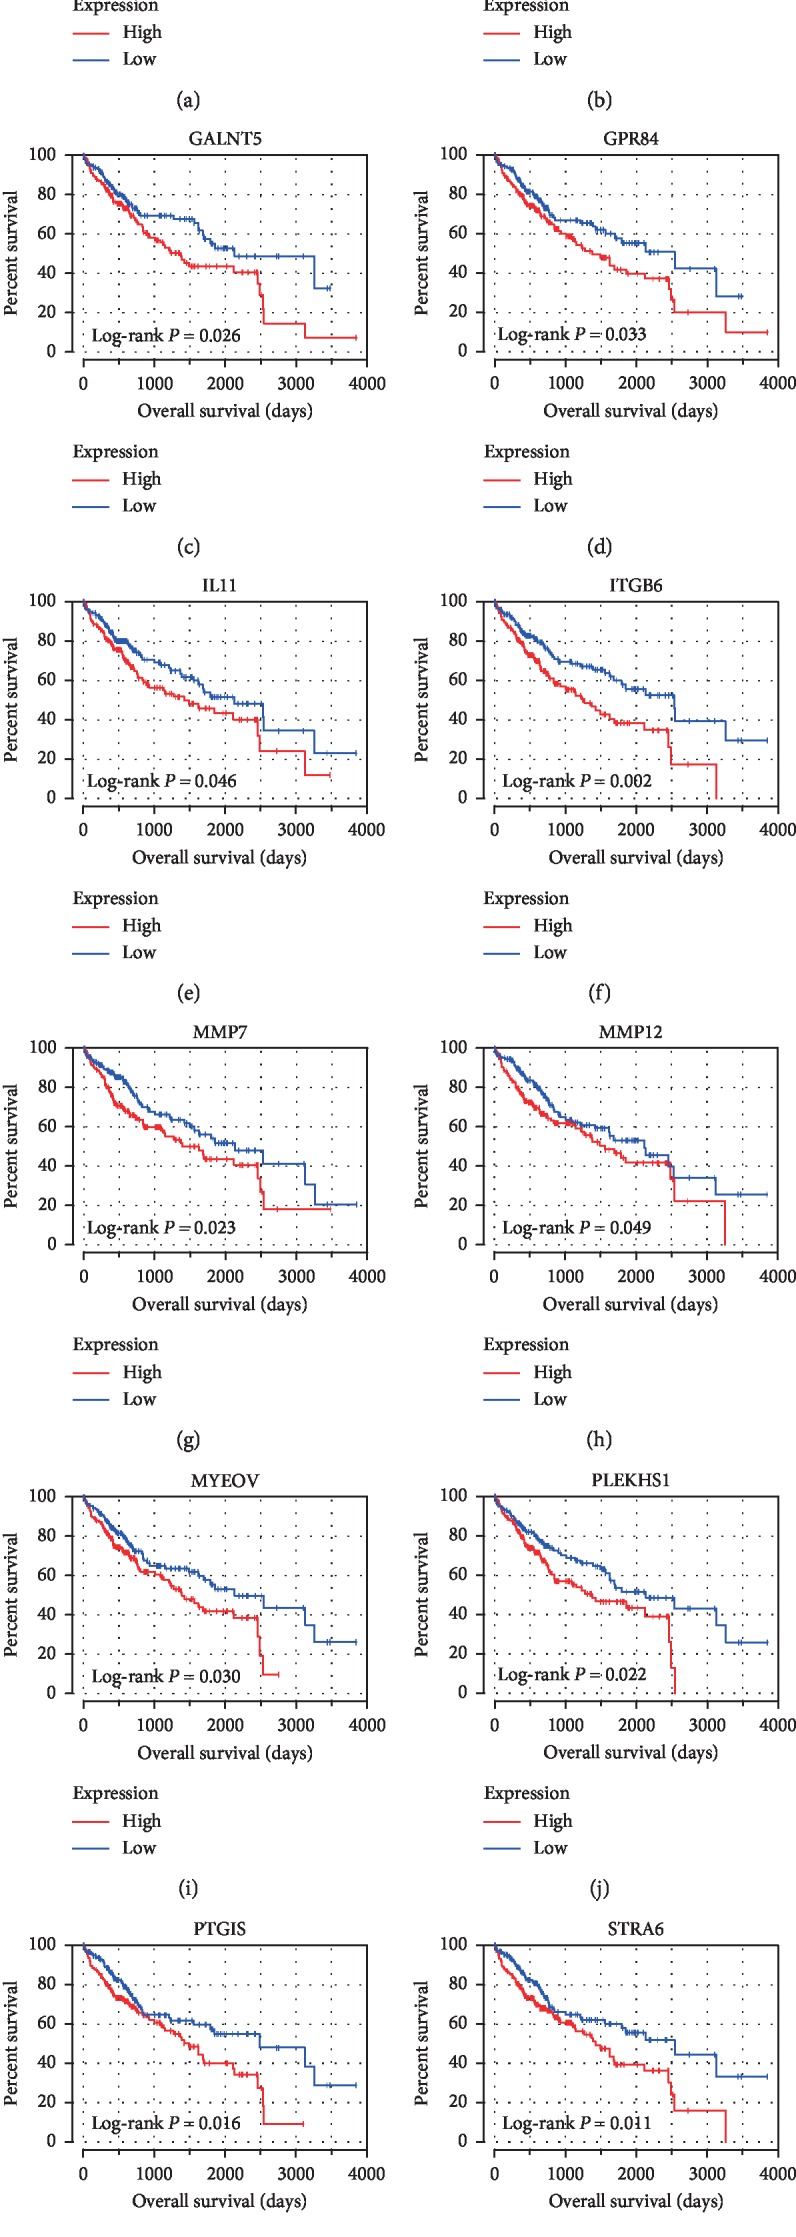
Figure 5.

Survival analysis between DEGs and poor OS in HCC. Kaplan–Meier curves were drawn for screening DEGs with prognostic value from the comparison between high (red line) and low (blue line) gene expression groups.

Survival analysis between DEGs and poor OS in HCC. Kaplan–Meier curves were drawn for screening DEGs with prognostic value from the comparison between high (red line) and low (blue line) gene expression groups.