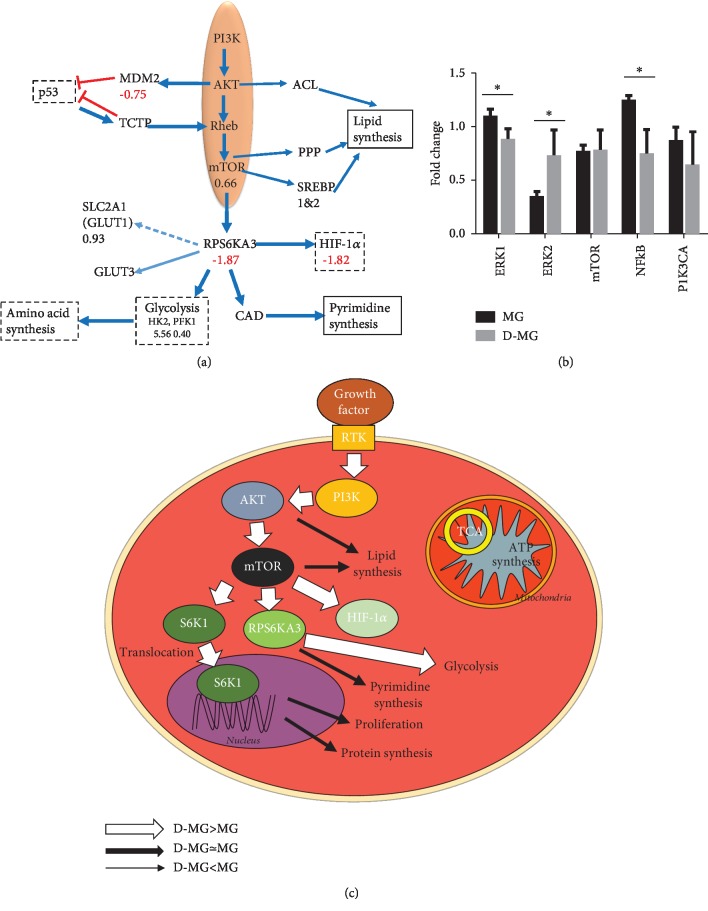
Figure 4.
mTOR signaling in the D-MG group. (a) RNA-sequencing results. (b) Validation of ERK genes using RT-PCR. ∗ indicates p < 0.05 (n = 3). (c) Schematic diagram showing the major changes in D-MG versus MG condition for mTOR signaling. D-MG shows enhanced mTOR activities that reduce tricarboxylic cycle (TCA), and D-MG shows increased glycolysis mediated by mTOR.

